Share
Share Tweet
Tweet Share
Share


R/Shiny is quite versatile from a developer’s perspective, and at Appsilon, we try our best to stretch those limits even further. That is what we did for the Data for Good project: Future Forests. Which, at first glance, doesn’t even appear to be an R/Shiny application.
In fact, that was a critical point of discussion when we first spoke with the designers. We needed to move away from the average Shiny look, often cluttered with information and boxes. We had to eliminate boxes, selectInputs, and other elements that scream old-school Shiny. We needed a Shiny app that focused readers on what mattered most: the research and the data.
TOC:
- How the Future Forest Ranges Shiny project started
- {Rhino} R framework in action
- Sentence Selector in a Shiny app with {shinyWidgets}
- Localization and Strings for Shiny translations with {shiny.i18n}
- Plots in Shiny with {eCharts4r}
- Maps in a Shiny app with {leaflet}
- Adding accessibility in Shiny apps with {viridis}
- Mobile UI for Shiny dashboards and applications
- Creating a Shiny mobile UI with {Rhino}
Making scientific research accessible – how the Future Forest Ranges Shiny project started
With the topic as critical as the future of our forests and climate change, we wanted the user to be able to enter, understand, and engage. The user should visit the application and browse through a simple yet valuable interface.
There are several frameworks and dashboarding tools out there. Find out if R/Shiny is right for your use case.
The design that we received was already moving toward this idea: remove visual noise.
But of course, all good things are built on the shoulders of what came before. If you look at Future Forests, you would be shocked that the current rework took only about a month. But this timeline was only possible due to the existing backend. The previous work done made sure we could focus on just one thing: a clean design.
The app changed significantly after two iterations, and that is not a bad thing. In fact, the idea is always to keep improving things.
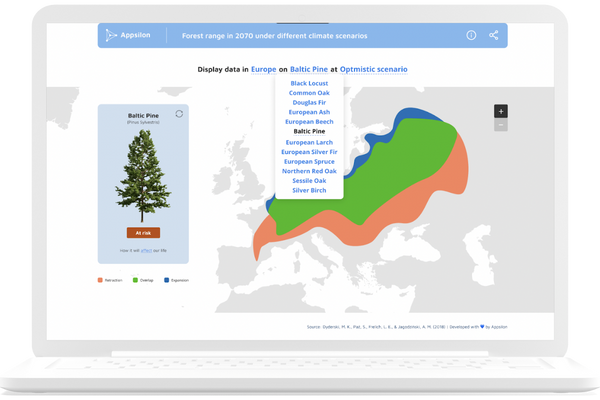
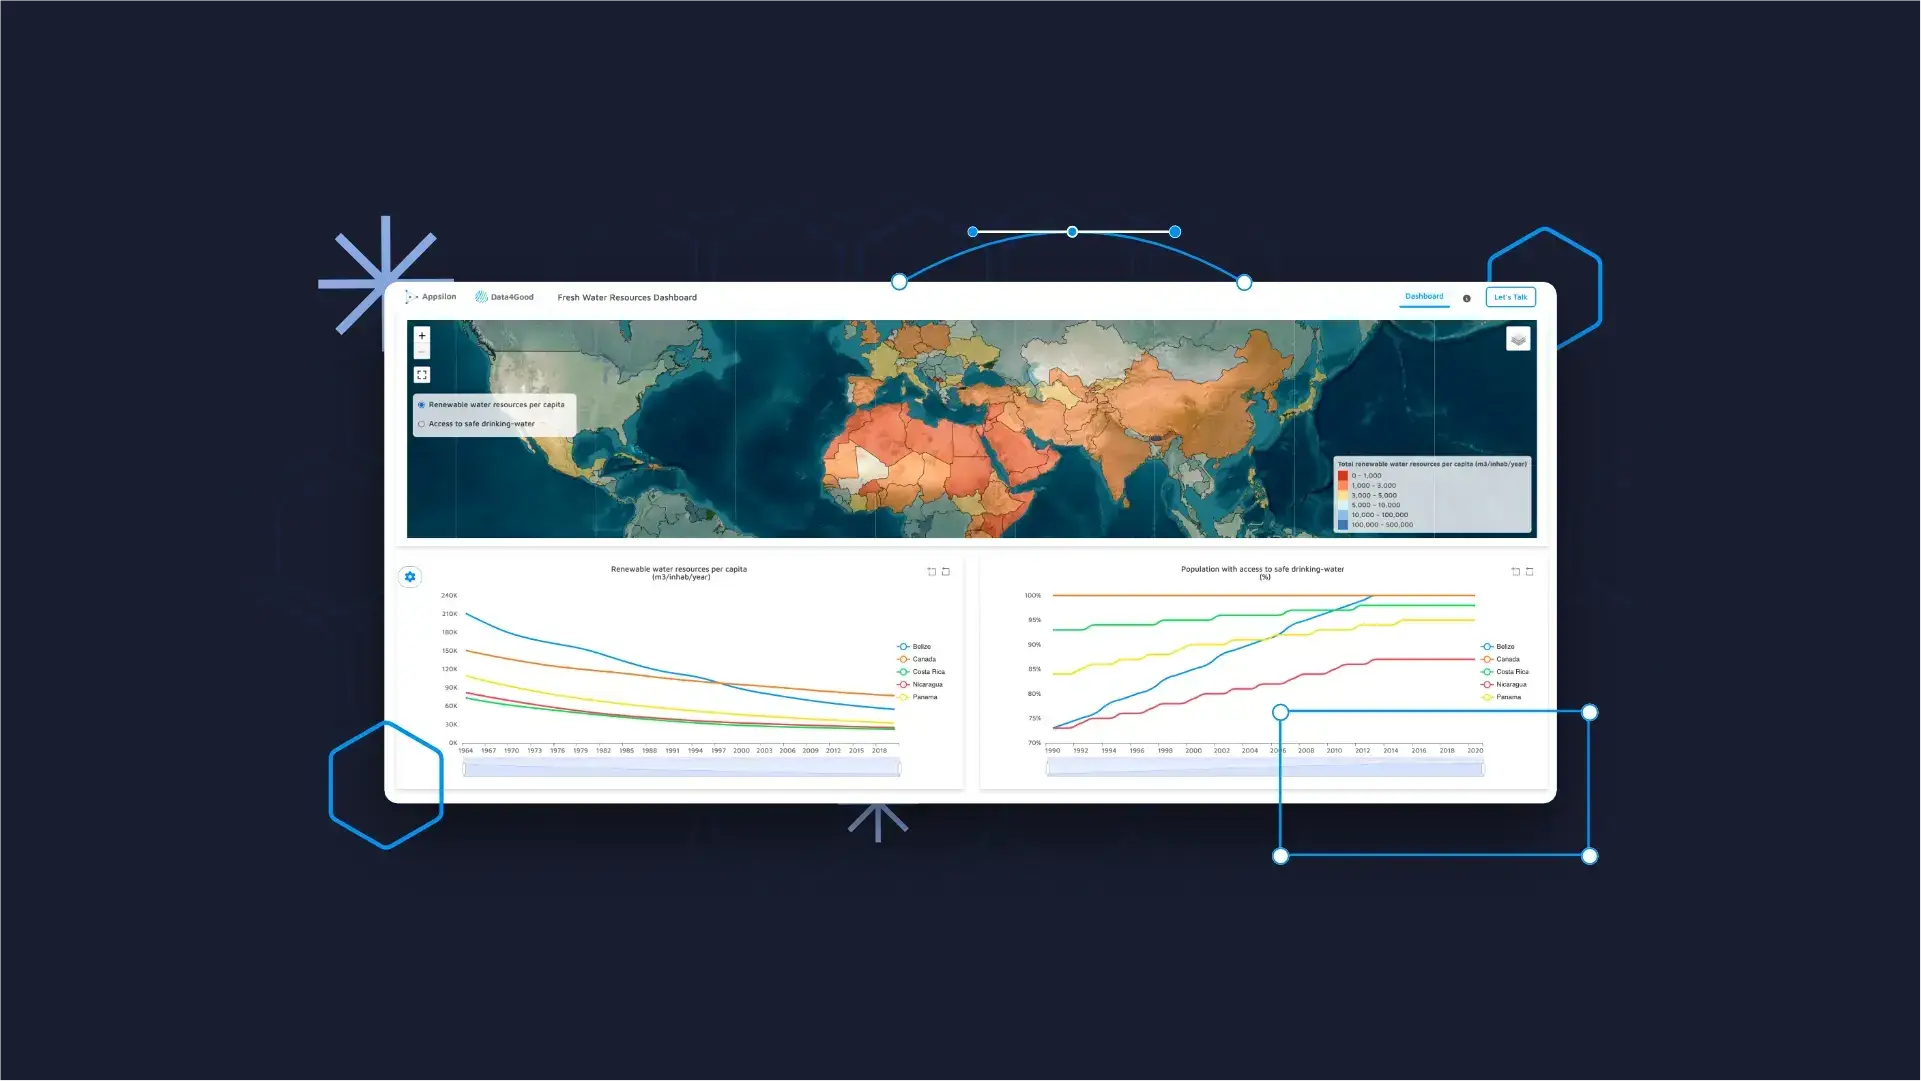
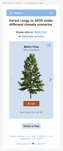
Initial dashboard design received from our design team.
{Rhino} R framework in action
We built the Future Forests application using {Rhino}, our opinionated framework for building production-grade R/Shiny apps. {Rhino} simplifies managing modules, complex styling through SASS, and nifty interaction through JavaScript. Additionally, we have a CI pipeline that directly talks to GitHub Actions, lints our code, and tests the app against an array of robust unit and E2E tests. All in all, without {Rhino}, doing all this would have increased our workload immensely.
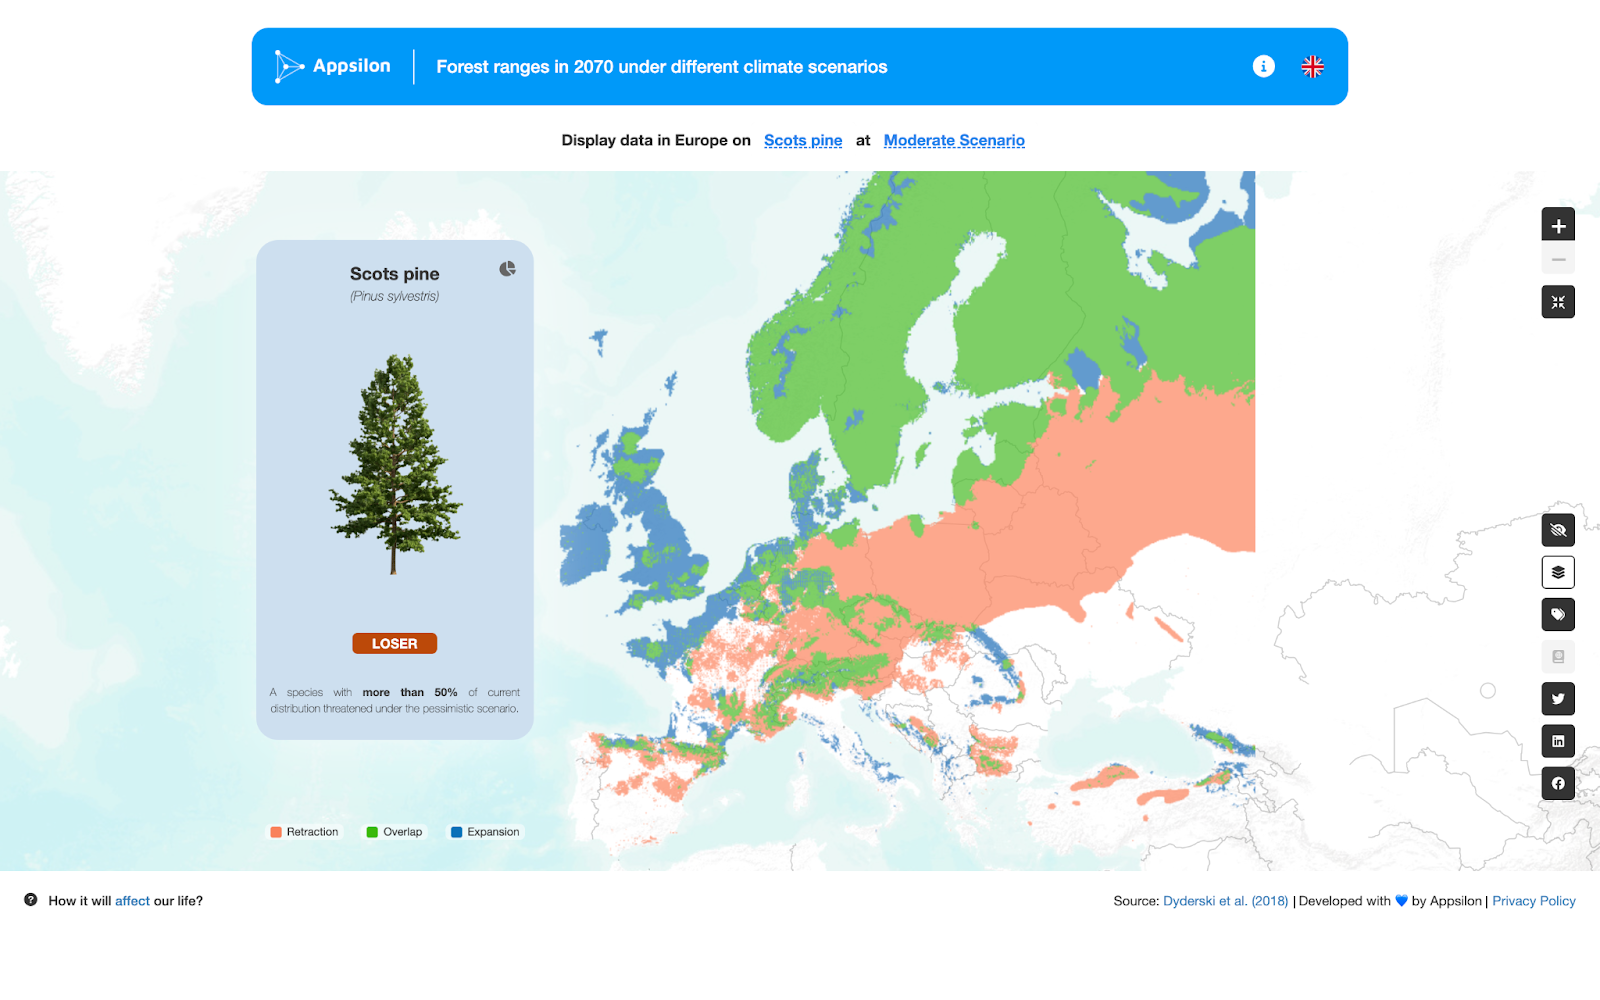
Current dashboard design.
Already have a dashboard built? With {Rhino} you can easily redesign a dashboard in R/Shiny.
Sentence Selector in a Shiny app with {shinyWidgets}
If you notice, one of the key features of Future Forests is that the selection in the app looks like it is a sentence. It’s clean and it works! But how did we implement this? Well, a lot of creative CSS goes behind the scenes but a key element in creating this was not starting from scratch.
Shiny apps can be slow. Learn how to speed things up by caching interactive elements in R/Shiny.
pickerInput from the {shinyWidgets} package has a parameter called options which takes a pickerOptions object with style = ‘link’ as a value. In other words, the pickerInput allows us to start with a specific style, which we then tweaked further using CSS.
The text inputs are defined by something that looks like the following:
pickerInput(
      inputId = ID_FOR_INPUT,
      label = "",
      choices = LIST_OF_CHOICES,
      selected = SELECTED_CHOICE_OR_OTHER_LOGIC,
      inline = TRUE,
      options = pickerOptions(style = "link")
)
Then, you just play with the CSS and it starts to look like what you see on the app. The layout also heavily depends on flex and flex properties to make things look neat and tidy. The text form selector is one such example.
Localization and Strings for Shiny translations with {shiny.i18n}
As you explore the app, especially when you do things like change scenarios, you will realize that a lot of text changes. For example, you can see this in the Scenario Description at the bottom of the Plot side of the card. This changeup occurs in several locations.
To achieve this, we use a translations.json file that we feed into a {shiny.i18n} object. {shiny.i18n} is another package that we developed and use at Appsilon which handles seamless translations.
This enables us to do two things:
- Change strings fast
- Support near-instantaneous translation between English and Polish
The translations.json looks something like this, and of course, is longer than just one element.
{
  "cultural_date_format": "%d-%m-%Y",
  "languages": [
    "key",
    "en",
    "pl"
  ],
  "translation": [
    {
      "key": "language_code",
      "en": "English",
      "pl": "Polish"
    },
    {
      "key": "app_title",
      "en": "Forest ranges in 2070 under different climate scenarios",
      "pl": "Zasięg lasów w 2070 r. w różnych scenariuszach klimatycznych"
    },
…
]
}
Each key is mapped to each element, which then serves the text using a variance of HTML tags, textOutputs, and many other ways you can access text in R/Shiny.
Plots in Shiny with {eCharts4r}
If you notice in the above card GIF, the plot looks super neat and animated. That’s thanks to the {echarts4r} library. We use it to plug in the data used to plot (it is crunched to proportions at some point) and then use the e_bar() function with more customization. The text that changes on the card also takes in the highest proportion and reorders the Retraction, Overlap, and Expansion percentages. All that is simply using R/Shiny to split our output into multiple textOutputs depending upon their comparison of the largest.
It gives us a nifty plot that looks great. In an earlier iteration, we had a pie chart in place of the bar chart. But at Appsilon, we don’t trust pie charts. So to ensure clear, unambiguous data-viz, we selected the bar chart.
Maps in a Shiny app with {leaflet}
{leaflet} is so common, that I wonder if I’ve ever seen a map in an R/Shiny dashboard that was not made on {leaflet}? It is tried and tested and has a range of customization.
In the Future Forests map, we use an Esri.WorldTerrain tile as the base leaflet layer, which we then use multiple layers to augment and each button toggles a specific leafletProxy. The labels come from CartoDB.VoyagerOnlyLabels tiles and the borders come from the Stamen.TonerLines tiles.
Looking to build advanced R maps? Follow this guide to building stunning Leaflet maps.
Each of these is standard and free to use. We use them in such a way that they all augment the map purposefully. We start with the borders and no labels, and then, the user can make it look as they choose.
What is the disabled button in the app?
There is a disabled button that serves a specific purpose. Our friends at the Polish Academy of Sciences were kind enough to give us data about the forest divisions in Poland. And since we only have that data in the Polish region, it made sense to enable this button only for the Polish version of the application.
This works as an independent layer that, again, works through leafletProxy.
Adding accessibility in Shiny apps with {viridis}
We have focused a bit on the accessibility of the application as well. We at Appsilon always try to be as inclusive as possible. Kindness is one of our values and we take it seriously.
Building accessible Shiny apps is easier than you think. Explore how to make your apps accessible with design theory, open-source packages, and A11Y guidelines.
Since colors are a major part of this app and help separate key information—whether the forests Retract, Overlap or Expand—we wanted to make this accessible for all. To do so, we added a colorblindness palette that can be toggled using the partial visibility button on the menu.
This not only changes the map, but also the colors for the plot and the legend.
All this is achieved by storing the colors in a colors.yml file, that looks something like this:
expansion: "#0d70b9"
overlap: "#39ba0c"
retraction: "#fa825b"
# viridis colorblind safe colors
expansion_blindsafe: "#fde725"
overlap_blindsafe: "#21908c"
retraction_blindsafe: "#440154"
What ensures that the colors are colorblind-safe? We got these colors from the viridis palette which is a standard for colorblind color usage.
Mobile UI for Shiny dashboards
Standard R/Shiny dashboards are used and developed within a desktop web browser. But what if it was possible to see the future of our forests from the palm of our hands?
We built the initial dashboard focusing on large to medium size desktop screens. But we wanted to reach a wider audience by bringing the dashboard to the smartphone. Inspired by the thought of engaging millions, the designers developed a wireframe for the mobile view of the dashboard.
Instead of overloading the user with visual information in a tiny space, the mobile UI shows a simple card. The card holds information about a tree and its overall status based on the scenario selected above. Once curiosity sinks in, clicking on the top right corner of the card reveals the bar graph seen in the desktop UI.
A little further below, a convenient “Toggle View” button allows you to switch to the map view and pan and zoom around Europe from your fingertips. If the urge to double-check with the image of the tree or the bar graph comes, you can click on Toggle View to jump right back into the card view.
Creating a Shiny mobile UI with {Rhino}
Creating a mobile UI was straightforward using {Rhino}. With the power of SASS given to us by {Rhino}, we defined an extensive array of media queries to cater to a wide range of mobile devices.
Ready for a unique Shiny UX? Discover how to add infinite scroll to your Shiny app.
To define a mobile UI, you would initially need to specify the dimensions you intend to support for your dashboard. With SASS, it was effortless to define breakpoints with variables and to iterate through each of them using ‘for loops’. For each component, we described the behavior within these breakpoints.
As the final touch, we implemented a simple Javascript function to enable the switch between the card and the map.
Elevating research with Shiny applications and design -always room for improvement
These are just a few highlights of what works in a well-thought-out Shiny app – from the science to the visualization. These are also some of the FAQs that we received once we released the app, and so we felt it important to share not just the what but also the how with the community.
We believe in a culture where everyone learns and grows together. If you feel there were other methods to achieve similar results, we always welcome feedback! There is a plethora of what goes under the hood from lots of hacking with JavaScript to a lot of SASS that builds the application and makes it look the way it does.
All in all, we believe this project has had a great impact on us and the community, by raising an important question for us all: what is happening to our forests?
We believe the urgency from awareness it creates also brings a certain hope: nothing is impossible to change if we give it our best.
Contact Us

Head of Marketing

Get Updates
Subscribe to Shiny Weekly Newsletter
Join 4000+ Shiny enthusiasts to see the latest Shiny news from the R community.