

 Share
Share Tweet
Tweet Share
Share


How to Generate Word Docs in Shiny with officer, flextable, and shinyglide

10 November 2022
Sometimes, when you develop a Shiny application you want to download the results of their analysis as a report. Generating reports from Shiny applications is a very broad topic. So in this tutorial, we’ll focus on generating Word documents from table data.
The example dataset used considers a scenario in which we want to report whether groups defined in a clinical trial are similar with respect to certain variables (e.g. age, gender, etc.).
Before you get started, is your data clean? Check out these two R packages for cleaning and validating datasets for a smooth experience.
The objective of this tutorial is to provide tools that can be extended or used in your project. The final application is not production-ready. But we have plenty of other tutorials on our blog to help you in your project’s journey.
- Preview Application
- Tutorial
- Packages Overview
- Step 1: UI
- Step 2: Server
- Handling Input Data
- Create Word doc
- Full Application Code
Shiny Application Preview and Generated Word Doc
In this tutorial, I’ll show you how to create the following application:
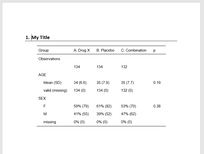
The downloaded Word document looks like this:
Generating Word Documents in R Shiny Tutorial
R Version
This tutorial uses R’s native pipe '|>' so in order to follow along, your R version should be ‘4.1.0’ or greater.
Install Required Packages
The following code will install the missing required packages to follow the tutorial.
# Required packages
list.of.packages <- c("atable",
                      "DT",
                      "flextable",
                      "officer",
                      "readr",
                      "remotes",
                      "rmarkdown",
                      "shiny",
                      "shinyglide",
                      "shinyWidgets")
New Packages
new.packages <- list.of.packages[!(list.of.packages %in% installed.packages()[,"Package"])]
Install Missing Packages
if(length(new.packages)) install.packages(new.packages)
Data Source
The application allows the user to upload their own data.
It expects an ADaM compliant ADSL dataset.
Looking to step-up your table data visualizations? Explore these top R package or visualizing table data for stunning tables in minutes.
In our application, we use a subset of synthetic CDISC data released during 2022.
The following code was used to create the example ‘csv‘ file:
# Install packages
remotes::install_github("insightsengineering/scda@*release")
remotes::install_github("insightsengineering/scda.2022@*release")
# Load libraries
library(scda)
library(scda.2022)
library(dplyr)
library(readr)
# Get adsl data
adsl_data <- scda::synthetic_cdisc_data("rcd_2022_02_28")$adsl |>
  select(USUBJID, AGE, SEX, RACE, DTHFL, TRT01A, BMRKR1, DTHCAT)
# Save local copy to upload to application
write_csv(adsl_data, "adsl_data.csv")
If you want to see what the first few rows of the dataset look like, run:
```{r, eval=TRUE}
readr::read_csv("adsl_data.csv") |>
  head(10) |>
  flextable::flextable() |>
  flextable::autofit()
```
Packages Overview for Generating Word Docs from Table Data
Below is a list of packages that implement the core functionality of the application.
- atable – supports the analysis and reporting of controlled clinical trials
- flextable – provides a framework to easily create tables for reporting and publications, with functions that let users create, modify, and format their tables
- officer – lets R users manipulate Word (.docx) and PowerPoint (.pptx) documents
- shinyglide – an R package that provides carousel-like or assistant-like components to Shiny applications, thanks to the Glide JavaScript library
Next, we’ll begin creating the Shiny application.
Building the Shiny Application for Generating Word Docs
In this section, we’ll go step-by-step showing how to create your own Shiny application and how to implement the packages mentioned above.
Step 0: Minimal Shiny App
Let’s start by defining the most minimal Shiny application:
library(shiny)
ui <- fluidPage()
server <- function(input, output, session) {}
shinyApp(ui, server)
Step 1: Defining Shiny UI
Here, we’ll build the application UI. We’ll add the different elements step-by-step so that you can see how each function changes the UI.
Step 1.1: Adding a Title to Shiny
We use ‘titlePanel()’ to create a panel containing the application’s title.
library(shiny)
ui <- fluidPage(
  # Add application title
  titlePanel("Compare Treatment Groups in Clinical Trials")

)
server <- function(input, output, session) {

}
shinyApp(ui, server)
If you run the code above, the application should like this:

Looking for custom R/Shiny styling and layouts? Try imola and shiny.fluent for a professional Shiny UI.
Step 1.2: Add Glide Functionality
Now, we want our app to have a glide component with two screens.
To achieve this, we’ll use functions from the shinyglide package:
- glide() – to insert the glide component
- screen() – to insert screens in the glide component
library(shiny)
library(shinyglide)
ui <- fluidPage(
  # Add application title
  titlePanel("Compare Treatment Groups in Clinical Trials"),
  # Add glide functionality
  glide(
    height = "100%",
    controls_position = "top",
    screen("Placeholder screen 1"),
    screen("Placeholder screen 2")
  )

)
server <- function(input, output, session) {

}
shinyApp(ui, server)
Here we set ‘height = “100%”‘ and ‘controls_position = “top”‘:
- height – controls the height of the glide (another option could have been something like “400px”)
- controls_position – determines where to place the controls (it can be either ‘top’ or ‘bottom’)
If you run the code above, the application should look like this:

Let’s continue by filling the contents of the screens.
Step 1.3: Fill Screen Contents
In Screen 1, we want the user to be able to upload and preview a dataset. To do so, we need to:
- add a title to the screen using
h1(). - create a layout (
sidebarLayout()) with a sidebar (sidebarPanel()) and the main area (mainPanel()). - place the file upload control in the sidebar using
fileInput(). We restrict the type of files that can be uploaded to.csvand.tsvby settingaccept = c(".csv", ".tsv"). - add a
dataTablepreview of the uploaded data in the main area. This requires us to use the ‘DT’ package.
In Screen 2, we want the user to be able to create a custom report. The report will consist of a user-defined title and a table comparing user-selected variables across user-selected groups. We will allow the user to preview the results and export them to Word.
To do this let’s:
- add a title to the screen using
h1(). - create a layout (
sidebarLayout()) with a sidebar (sidebarPanel()) and the main area (mainPanel()). - add input controls to the sidebar:
textInputwill be used to define the title of the report and the file name of the exported Word documentpickerInput(from shinyWidgets package) will be used to select the grouping variable and to select the variables that we will compare.
- add actions buttons to the sidebar: one button will be used to preview results and the other will export the report as a Word document.
- add an
htmlOutputto the main area to preview the results.
Regarding, pickerInput we can allow a single grouping variable using multiple = FALSE and more than one comparison variable with multiple = TRUE. You might notice that choices = NULL in both cases. This is because until the user uploads a dataset, we don’t know the variables we can choose from. We will take care of this in the server.
library(shiny)
library(shinyglide)
library(DT)
library(shinyWidgets)
ui <- fluidPage(
  # Add application title
  titlePanel("Compare Treatment Groups in Clinical Trials"),
  # Add glide functionality
  glide(
    height = "100%",
    controls_position = "top",
    screen(
      # Contents of screen 1
      h1("Upload Data"),
      sidebarLayout(
        sidebarPanel(
          # Upload data
          fileInput(
            inputId = "raw_data",
            label = "Upload .csv or .tsv",
            accept = c(".csv", ".tsv")
          )
        ),
        mainPanel(
          # Preview data
          DTOutput("preview_data")
        )
      )
    ),
    screen(
      # Contents of screen 2
      h1("Create Report"),
      sidebarLayout(
        sidebarPanel(
          # Set word document title
          textInput(
            inputId = "document_title",
            label = "Set Word Document Title",
            value = "My Title"
          ),
          # Select grouping variable
          pickerInput(
            inputId = "group_var",
            label = "Select Group Variable",
            choices = NULL,
            multiple = FALSE
          ),
          # Select the variables used to compare groups
          pickerInput(
            inputId = "comparison_vars",
            label = "Select Variables to Compare",
            choices = NULL,
            multiple = TRUE
          ),
          # Set word document filename
          textInput(
            inputId = "filename",
            label = "Set Word Document Filename",
            value = "my_comparison"
          ),
          # Preview results
          actionButton(
            inputId = "preview_results",
            label = "Preview Results"
          ),
          # Download word document
          downloadButton(
            outputId = "download_word_document",
            label = "Download Word Document"
          )
        ),
        mainPanel(
          # Preview results
          htmlOutput("result")
        )
      )
    )
  )
)
server <- function(input, output, session) {

}
shinyApp(ui, server)
If you run the code above, the application should look like this:
Before diving into the server, there is one more thing we will modify in the UI.
Currently, the user can move to the second screen without uploading any file. If there is no data, not only will we not have any variables to select but also the UX makes no sense to proceed and click a download button.
Fortunately, we can enable the Next button based on a condition. In our Shiny app, we’ll enable the button only when the preview table exists. We will use the next_condition argument of screen(). The next_condition expects JavaScript code.
library(shiny)
library(shinyglide)
library(DT)
library(shinyWidgets)
ui <- fluidPage(
  # Add application title
  titlePanel("Compare Treatment Groups in Clinical Trials"),
  # Add glide functionality
  glide(
    height = "100%",
    controls_position = "top",
    screen(
      # Contents of screen 1
      h1("Upload Data"),
      sidebarLayout(
        sidebarPanel(
          # Upload data
          fileInput(
            inputId = "raw_data",
            label = "Upload .csv or .tsv",
            accept = c(".csv", ".tsv")
          )
        ),
        mainPanel(
          # Preview data
          DTOutput("preview_data")
        )
      ),
      # Disable Next button until data is uploaded
      next_condition = "output.preview_data !== undefined"
    ),
    screen(
      # Contents of screen 2
      h1("Create Report"),
      sidebarLayout(
        sidebarPanel(
          # Set word document title
          textInput(
            inputId = "document_title",
            label = "Set Word Document Title",
            value = "My Title"
          ),
          # Select grouping variable
          pickerInput(
            inputId = "group_var",
            label = "Select Group Variable",
            choices = NULL,
            multiple = FALSE
          ),
          # Select the variables used to compare groups
          pickerInput(
            inputId = "comparison_vars",
            label = "Select Variables to Compare",
            choices = NULL,
            multiple = TRUE
          ),
          # Set word document filename
          textInput(
            inputId = "filename",
            label = "Set Word Document Filename",
            value = "my_comparison"
          ),
          # Preview results
          actionButton(
            inputId = "preview_results",
            label = "Preview Results"
          ),
          # Download word document
          downloadButton(
            outputId = "download_word_document",
            label = "Download Word Document"
          )
        ),
        mainPanel(
          # Preview results
          htmlOutput("result")
        )
      )
    )
  )
)
server <- function(input, output, session) {

}
shinyApp(ui, server)
If you run the code above, the application should look like this:
If you upload data, you are still unable to move to the second screen. This is because we haven’t yet defined the output in the server. Let’s do that in the next section.
Step 2: Defining the Server
In this section, we’ll explain what is achieved by each code chunk in the server. In our case, I’ll go one code chunk at a time and show the full working application code at the end (including both the UI and Server).
How to Handle Input Data
The following code is used to handle fileInput.
- We use req to ensure
input$raw_datais available before proceeding with the action - We capture the file extension of the input using
tools::file_ext - We use
switchto read the data using eitherreadr::read_csvorreadr::read_delimbased on the file extension - We use
validate()to provide a meaningful message when the user tries to upload an invalid file
  # Handle input data
  data <- reactive({
    req(input$raw_data)
    ext <- file_ext(input$raw_data$name)
    switch(ext,
           csv = read_csv(input$raw_data$datapath),
           tsv = read_delim(input$raw_data$datapath, delim = "\t"),
           validate("Invalid file. Please upload a .csv or .tsv file")
    )
  })
Create a Table to Preview Data
The code below uses DT::datatable to build the table that previews uploaded data.
rownames = FALSEexcludes rownames from the tableoptions = list(searching = FALSE, filter = FALSE)removes both searching and filtering from thedatatable
# Create DataTable that shows uploaded data
  output$preview_data <- renderDT({ data() |>
      datatable(
        rownames = FALSE,
        options = list(searching = FALSE, filter = FALSE)
      )
  })
Update Input Choices
We can use the following code to update `choices` when data is uploaded. The possible values will be the colnames of the uploaded dataset.
# Update input choices when data is uploaded
  observeEvent(data(), {
    var_names = colnames(data())

    updatePickerInput(
      session = session,
      inputId = "group_var",
      choices = var_names
    )

    updatePickerInput(
      session = session,
      inputId = "comparison_vars",
      choices = var_names
    )
  })
Create Comparison Table using atable and flextable
This reactive uses atable::atable and flextable to create the comparison table. We use flextable::autofit() to provide some styling to the table. This reactive will be used by other server functions.
 # Create comparison table
  word_table <- reactive({ atable( x = data(), target_cols = input$comparison_vars, group_col = input$group_var, format_to = "word" ) |>
      regulartable() |>
      autofit()
  })
Create a Word Document using officer and flextable
We use functions from `officer` and `flextable` packages to create the reactive that contains the Word Document.
officer::read_docx()creates a default empty fileofficer::body_add_par()is used to add a paragraph of text.- We define a title using
style = "heading 1". As you see, the title is the one supplied by the user in thetextInput - We can add an empty line by suplying
value = ""
- We define a title using
flextable::body_add_flextable()adds a flextable into a Word Document
# Create word document
  word_document <- reactive({ read_docx() |>
      body_add_par(value = input$document_title, style = "heading 1") |>
      body_add_par(value = "", style = "Normal") |>
      body_add_flextable(word_table())
  })
Preview Word Results in Shiny
When the button to preview results is clicked:
- A Word Document named
preview_results.docxis created in the root of the directory with the contents ofword_document() preview_results.docxis converted to HTML usingrmarkdown::pandoc_convert. This step is necessary to display the preview of the results.- We build the output that preview the results using
includeHTML().reqis used to avoid error messages before the button is clicked for the first time.
# Create files to preview results
  observeEvent(input$preview_results, {
    # Save current file
    word_document() |>
      print(target = "preview_results.docx")

    # Transform to html
    pandoc_convert(
      input = "preview_results.docx",
      to = "html",
      output = "preview_results.html"
    )
  })

  # Preview result
  #  Trigger only when the button is clicked
  output$result <- renderUI({
    req(input$preview_results)
    includeHTML("preview_results.html")
  })
Download Word Document
The following code is used to export the results to Word. We use the user-defined filename and make use of print() again to save the file.
# Download Handler
  output$download_word_document <- shiny::downloadHandler( filename = function() { paste(input$filename, ".docx", sep = "") }, content = function(file) { word_document() |>
        print(target = file)
    }
  )
Full Shiny Application Code: Generating Word Docs from Table Data Using officer, flextable, and shinyglide
And there you have it! A Shiny app that permits users to generate word documentation from table data. We also added a ‘Next’ button that ensures users don’t get confused by proceeding to the next screen without adding data.
How does your team use Shiny to handle data and reporting? We’d love to hear about your experiences. Share your Shiny stories with us on Twitter or LinkedIn and how you plan on improving on what we built together today!
If you’d like to add more to your Shiny creation, be sure to check out our Shiny blog and learn from our Shiny devs, UI designers, and engineers. We cover topics ranging from Shiny layouts, business use cases with R and Shiny, and much more!
# Load libraries
library(atable)
library(DT)
library(flextable)
library(officer)
library(rmarkdown)
library(shiny)
library(shinyglide)
library(shinyWidgets)
# Define UI
ui <- fluidPage(
  # Add application title
  titlePanel("Compare Treatment Groups in Clinical Trials"),
  # Add glide functionality
  glide(
    height = "100%",
    controls_position = "top",
    screen(
      # Contents of screen 1
      h1("Upload Data"),
      sidebarLayout(
        sidebarPanel(
          # Upload data
          fileInput(
            inputId = "raw_data",
            label = "Upload .csv or .tsv",
            accept = c(".csv", ".tsv")
          )
        ),
        mainPanel(
          # Preview data
          DTOutput("preview_data")
        )
      ),
      # Disable Next button until data is uploaded
      next_condition = "output.preview_data !== undefined"
    ),
    screen(
      # Contents of screen 2
      h1("Create Report"),
      sidebarLayout(
        sidebarPanel(
          # Set word document title
          textInput(
            inputId = "document_title",
            label = "Set Word Document Title",
            value = "My Title"
          ),
          # Select grouping variable
          pickerInput(
            inputId = "group_var",
            label = "Select Group Variable",
            choices = NULL,
            multiple = FALSE
          ),
          # Select the variables used to compare groups
          pickerInput(
            inputId = "comparison_vars",
            label = "Select Variables to Compare",
            choices = NULL,
            multiple = TRUE
          ),
          # Set word document filename
          textInput(
            inputId = "filename",
            label = "Set Word Document Filename",
            value = "my_comparison"
          ),
          # Preview results
          actionButton(
            inputId = "preview_results",
            label = "Preview Results"
          ),
          # Download word document
          downloadButton(
            outputId = "download_word_document",
            label = "Download Word Document"
          )
        ),
        mainPanel(
          # Preview results
          htmlOutput("result")
        )
      )
    )
  )
)
# Define server
server <- function(input, output, session) {
  # Handle input data
  data <- reactive({
    req(input$raw_data)
    ext <- tools::file_ext(input$raw_data$name)
    switch(ext,
           csv = readr::read_csv(input$raw_data$datapath),
           tsv = readr::read_delim(input$raw_data$datapath, delim = "\t"),
           validate("Invalid file. Please upload a .csv or .tsv file")
    )
  })

  # Create DataTable that shows uploaded data
  output$preview_data <- DT::renderDT({ data() |>
      DT::datatable(
        rownames = FALSE,
        options = list(
          searching = FALSE,
          filter = FALSE
        )
      )
  })

  # Update input choices when data is uploaded
  observeEvent(data(), {
    var_names = colnames(data())

    updatePickerInput(
      session = session,
      inputId = "group_var",
      choices = var_names
    )

    updatePickerInput(
      session = session,
      inputId = "comparison_vars",
      choices = var_names
    )
  })

  # Create comparison table
  word_table <- reactive({ atable::atable( x = data(), target_cols = input$comparison_vars, group_col = input$group_var, format_to = "word" ) |>
      flextable::regulartable() |>
      flextable::autofit()
  })

  # Create word document
  word_document <- reactive({ read_docx() |>
      body_add_par(value = input$document_title, style = "heading 1") |>
      body_add_par(value = "", style = "Normal") |>
      body_add_flextable(word_table())
  })

  # Create files to preview results
  observeEvent(input$preview_results, {
    # Save current file
    word_document() |>
      print(target = "preview_results.docx")

    # Transform to html
    pandoc_convert(
      input = "preview_results.docx",
      to = "html",
      output = "preview_results.html"
    )
  })

  # Preview result
  #  Trigger only when the button is clicked
  output$result <- renderUI({
    req(input$preview_results)
    includeHTML("preview_results.html")
  })

  # Download Handler
  output$download_word_document <- shiny::downloadHandler( filename = function() { paste(input$filename, ".docx", sep = "") }, content = function(file) { word_document() |>
        print(target = file)
    }
  )
}
# Run app
shinyApp(ui, server)
Contact Us
Project Manager

Get Updates
Subscribe to Shiny Weekly Newsletter
Join 4000+ Shiny enthusiasts to see the latest Shiny news from the R community.
Also on data.table
