Share
Share Tweet
Tweet Share
Share


Intermediate SQL for Data Science
Running data queries in the database can offer significant speed improvements over doing so in R or Python. There’s no need to drag the entire dataset to memory and run the calculations once the loading completes. The runtime differences can be drastic, depending on the dataset size.
That’s why SQL is your best friend when it comes to larger datasets. And there’s no better way to improve your SQL skills than going over a couple of intermediate concepts, wrapped in a little something called analytical functions. These functions perform computations over multiple rows, but they also return multiple rows. We’ll go over a couple of them in this tutorial.
This article is structured as follows:
Database and Data Introduction
This article assumes you have the PostgreSQL database installed and configured. It also assumes basic knowledge of SQL, so words like SELECT, WHERE, BETWEEN, FROM, and the others shouldn’t feel new.
With regards to the data, we’ll use a small table called ORDERS which you can download from here. The previous URL contains SQL code for generating and populating three tables, so please execute it before proceeding.
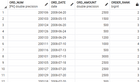
If you did everything correctly, the following SELECT statement:
Should yield the following dataset:
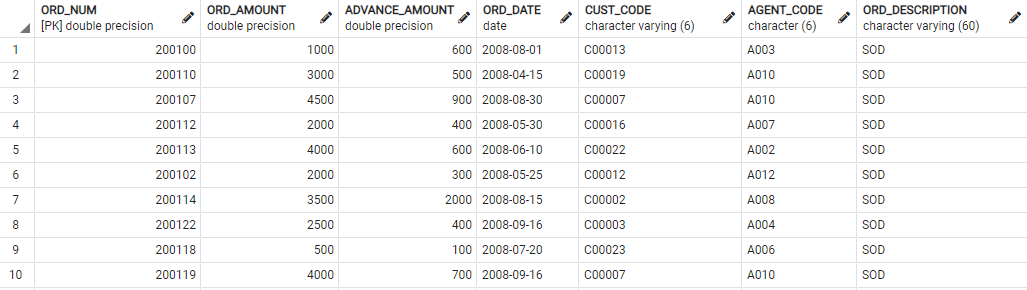
Image 1 – Orders table data
Which means you’re ready to proceed.
Running Averages
If you have any experience with SQL, it’s likely you’re familiar with aggregation functions such as SUM, AVG, MIN, and MAX. It’s also likely you’ve used them in the GROUP BY clause. As it turns out, you can also use them in ORDER BY to obtain a running total, average, minimum, or maximum.
Let’s go over a concrete example to make this more clear. You want to monitor the states of your sales agent, and want to see their performance in the third quarter of 2008. To do so, you can calculate the running average revenue and the total revenue obtained.
Here’s the code:
And here are the results:
Image 2 – Running average and total revenue per agent in the third quarter of 2008
And that’s how easy it is! Let’s proceed to the next one.
First Values
In Postgres, you can use the FIRST_VALUE analytical function to return the value of a specified column from the first row of the window frame. Similarly, you can use the LAST_VALUE and NTH_VALUE functions.
In our Orders table example. you could use the FIRST_VALUE function to check the date gap between the first and the next purchase per customer. Here’s the code for doing so:
Here are the results:
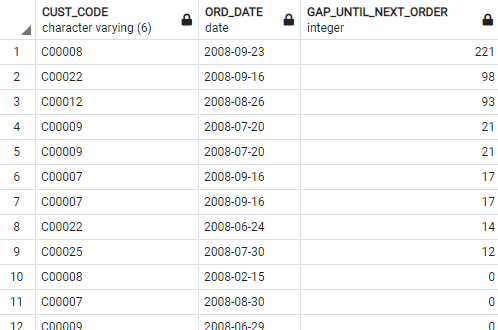
Image 3 – Gaps between first and the next purchase per customer
Take a moment and think of all use cases when functionality like this could be useful. More than a handful, I’m sure.
Let’s proceed to the next one.
Leads and Lags
As the name suggests, the LEAD function fetches the value of a specific attribute from the next row and returns it in the current row. It takes two arguments:
COLUMN_NAME– name of the attribute from which the next value is fetchedINDEX– number of rows relative to the current one
On the other hand, the LAG function does the opposite. It fetches the value for a column of interest from the previous INDEX rows.
Here’s an example – we want to find out what is the last highest amount for which an order has been sold. Here’s the code:
And here are the results:
Image 4 – Last highest amount for which an order has been sold per agent
Let’s cover one more analytical function before calling it a day.
Ranking
In PostgreSQL, you can use RANK and DENSE_RANK as numbering functions. They are here to assign an integer value to a row and are particularly useful when you have to find the nth highest or lowest record from the table.
The two functions are a bit different when it comes to assigning integer values. DENSE_RANK will return consecutive ranks, while RANK will return ranking in such a way where a rank is skipped in case of a tie.
For example, ranking with DENSE_RANK would return (1, 2, 2, 3), while ranking with RANK would return (1, 2, 2, 4) – hence a skipped rank due to a tie.
Let’s see this in action – we want to find the second highest order values for each month. Here’s the code:
And here are the results:
Image 5 – Second highest order values for each month
And that’s just enough for today. Let’s wrap things up in the next section.
Conclusion
And there you have it – a handful of analytical functions to take your SQL and database knowledge to the next level. These are particularly useful in data science, as most of the time the worthy insights are hidden, and the only way to obtain them is through some creative data manipulation.
Analytical functions provide a perfect way for doing so.
Learn More
- What Can I Do With R? 6 Essential R Packages for Programmers
- How to Analyze Data with R: A Complete Beginner Guide to dplyr
- Hands-on R and dplyr – Analyzing the Gapminder Dataset
- 7 Must-Have Skills to Get a Job as a Data Scientist
- Tableau vs. R Shiny: Which Excel Alternative is Right For You?

Appsilon is hiring for remote roles! See our Careers page for all open positions, including a Senior React Developer and Senior R Shiny Developers. Join Appsilon and work on groundbreaking projects with the world’s most influential Fortune 500 companies.
Contact Us
Project Manager

Get Updates
Subscribe to Shiny Weekly Newsletter
Join 4000+ Shiny enthusiasts to see the latest Shiny news from the R community.