Share
Share Tweet
Tweet Share
Share


R Shiny Dashboard Tutorial: Go From Basic Prototype to Production-Ready App

10 December 2019
Updated: July 12, 2022.
As web dashboards have become the norm for interacting with data, looks and added functionality have taken a more prominent role. Dashboard users expect the typical look and feel and interactivity they get when surfing the web. To help fill the gap between data scientists and developers, packages that simplify and streamline the dashboard creation process has become more important as part of the dashboard creation workflow.
Today we’ll walk you through a simple R Shiny dashboard tutorial. We’ll start with a basic shiny dashboard that uses no libraries. Then we’ll show you how you can enhance it using two different approaches based on the most popular UI frameworks: Bootstrap and Semantic UI. Finally, we’ll wrap up by giving you a taste of how far you can go using only R/Shiny to create a pure custom solution.
Prefer video over text? Check our video tutorial on how to build and cusomize a simple R Shiny dashboard.
Table of contents:
- R Shiny Dashboard Tutorial: Basic Dashboard with R Shiny
- Bootstrap Approach: shinydashboard Package
- Semantic UI Approach: shiny.semantic Package
- Custom Approach to R Shiny Dashboards: No Frameworks Whatsoever
- Summary of R Shiny Dashboard Tutorial
R Shiny Dashboard Tutorial: Basic Dashboard with R Shiny
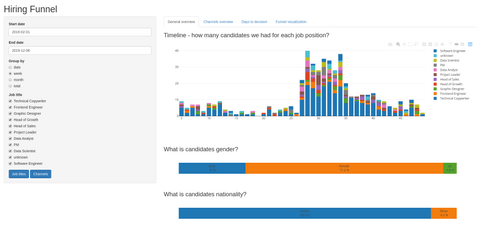
We will start with a proof of concept dashboard created using base shiny (This particular dashboard was created for our company’s internal tools for our hiring processes, but all data in the examples is randomly generated).
Image 1 – Semantic UI dashboard
A great example of the advantages of shiny for creating simple dashboards – our UI can be easily defined:
fluidPage(
  headerPanel("Hiring Funnel"),
  sidebarPanel(...),
  mainPanel(...)
)
Coupled with some server behavior for the different inputs and outputs, we end up with a complete dashboard that, while simple, will become the base for our following examples.
Bootstrap Approach: shinydashboard Package
Shiny already includes bootstrap as a default framework. shinydashboard is probably the most well-known extension to shiny when it comes to styling your dashboards in a simple and quick way. In fact, enabling it is as simple as loading the library and replacing the wrappers for our main dashboard components:
library(shinydashboard)

dashboardPage(
  dashboardHeader(...),
  dashboardSidebar(...),
  dashboardBody(...)
)
A simple way to breathe new life into your dashboards! However, it is important to keep in mind that:
- Customization is limited (CSS is an option)
- Color themes are available
- You’ll be pigeonholed in the bootstrap ecosystem
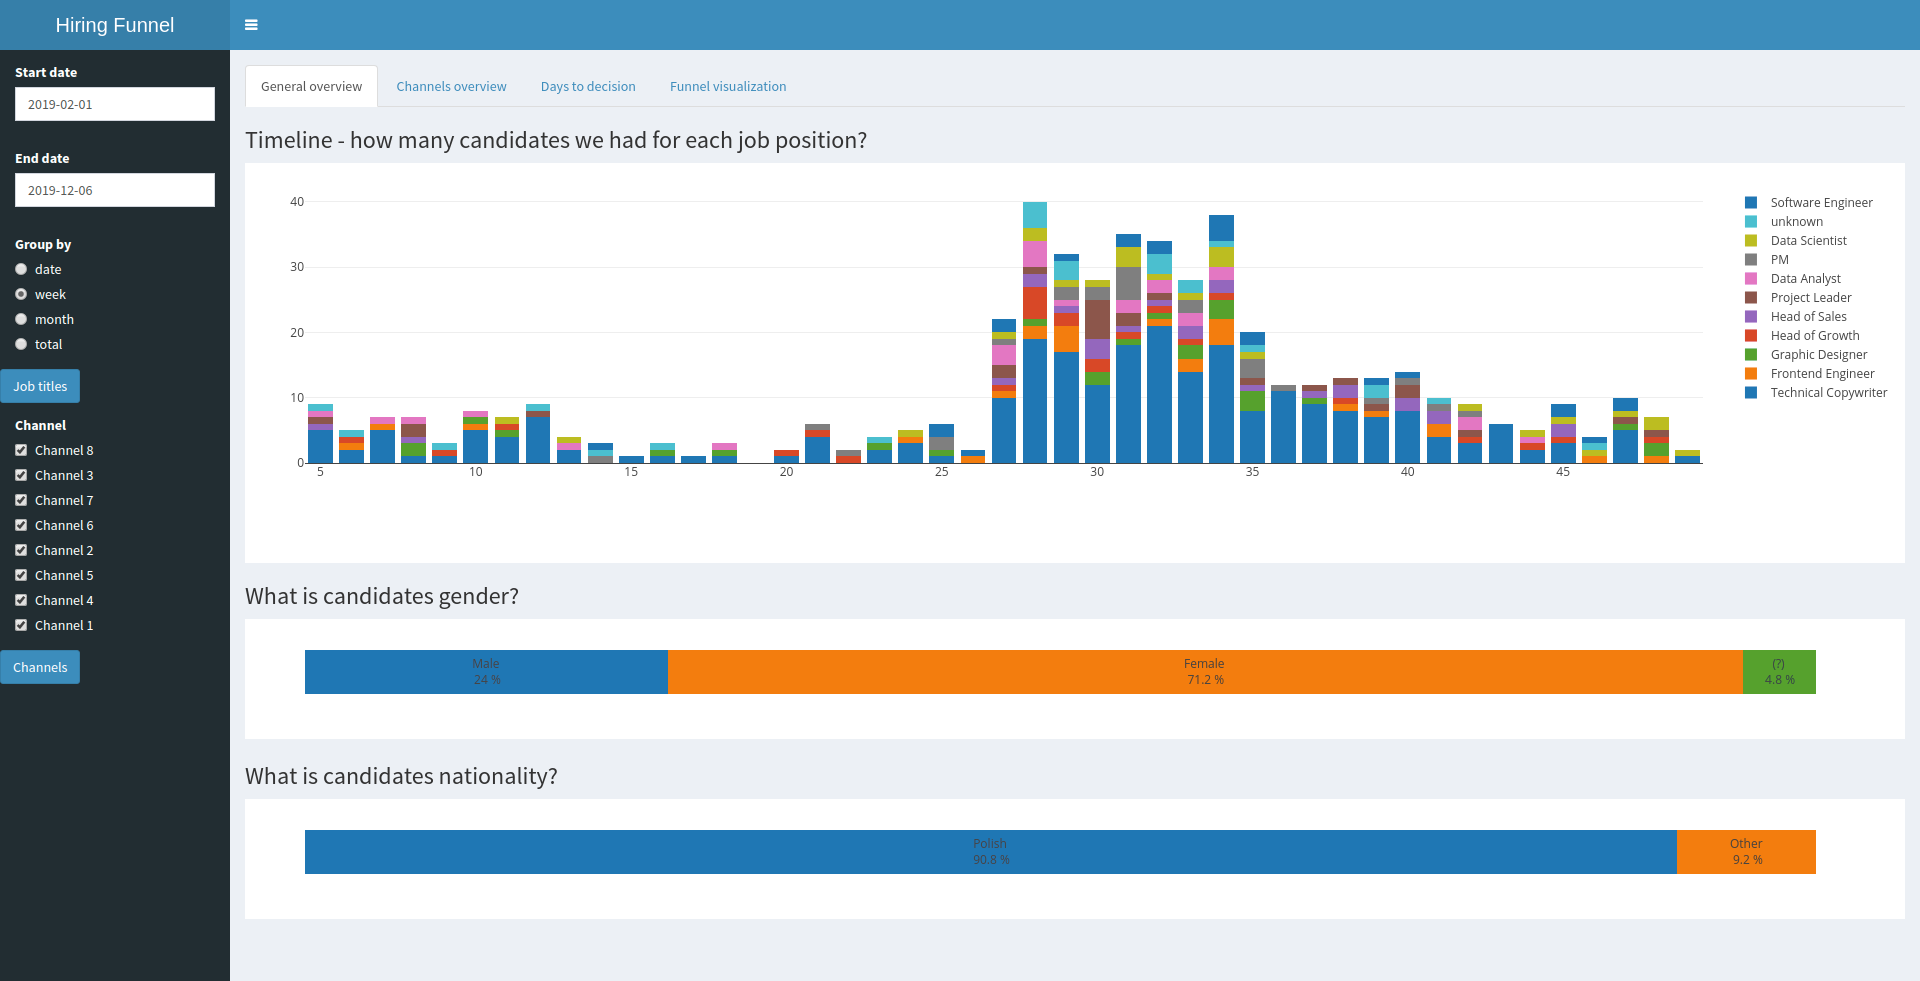
Image 2 – ShinyDashboard example
Semantic UI Approach: shiny.semantic Package
Another possible solution, especially if you would like more customization and would like to switch bootstrap in favor of semantic UI, is to use shiny.semantic in conjunction with semantic.dashboard. This opens a different set of UI elements that can be used, so elements such as tabs and inputs might need to be updated if you are making the switch from shiny or shinydashboard.
From the main layout part, semantic.dashboard works very similarly to how shinydashboard does. A few differences exist when it comes to function arguments, but the general structure remains the same:
library(semantic.dashboard)
library(shiny.semantic)

dashboardPage(
  dashboardHeader(...),
  dashboardSidebar(...),
  dashboardBody(...)
)
Some changes are needed for some components. Two good examples are:
Date inputs. Switching from bootstrap means we no longer have access to bootstrap components. Moving from Bootstrap requires some changes:
# Bootstrap
dateInput("date_from", "Start date", value = "2019-02-01", weekstart = 1)
# Semantic UI
date_input("date_from", "Start date", value = "2019-02-01", icon = "")
Tab sets. Another example of this is tab sets; Bootstrap tabsets need to be replaced by their Semantic counterpart:
# Bootstrap
tabsetPanel(
  tabPanel("General overview", ...)
  tabPanel("Channels overview", ...)
  tabPanel("Days to decision", ...)
  tabPanel("Funnel visualization", ...)
)

# Semantic UI
tabset(
  list(menu = div("General overview"), content = div(...)),
  list(menu = div("Channels overview"), content = div(...)),
  list(menu = div("Days to decision"), content = div...()),
  list(menu = div("Funnel visualization"), content = div(...))
)
The semantic UI version is a bit more verbose, but it allows for more customization regarding the internal HTML structure. You also get access to all of the semantic UI library.
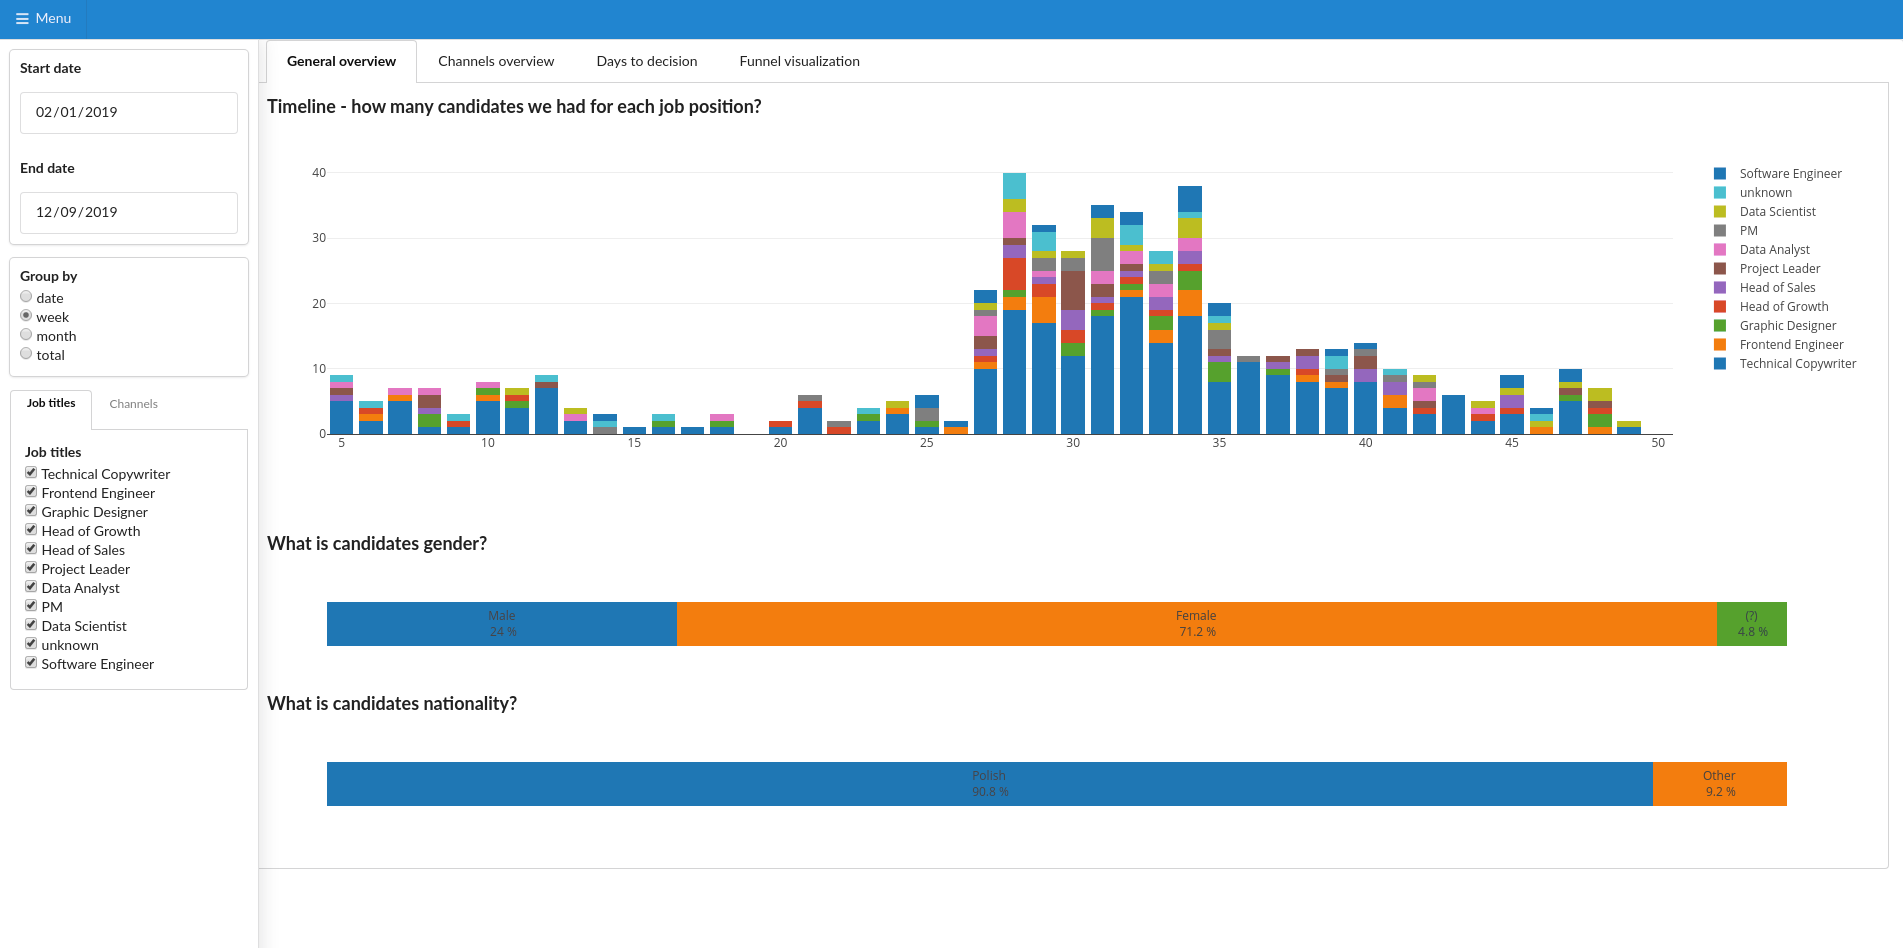
Image 3 – Semantic Dashboard example
Custom Approach to R Shiny Dashboards: No Frameworks Whatsoever
We can also go a different route and dive into a fully custom solution which allows for a much higher level of customization. However, it also requires a lot more knowledge when it comes to HTML, CSS, and JS. This solution is usually reserved for applications where the layout, theme, or overhaul experience is completely different from existing packages.
As an example, our internal app using a fully custom approach ended up like this:
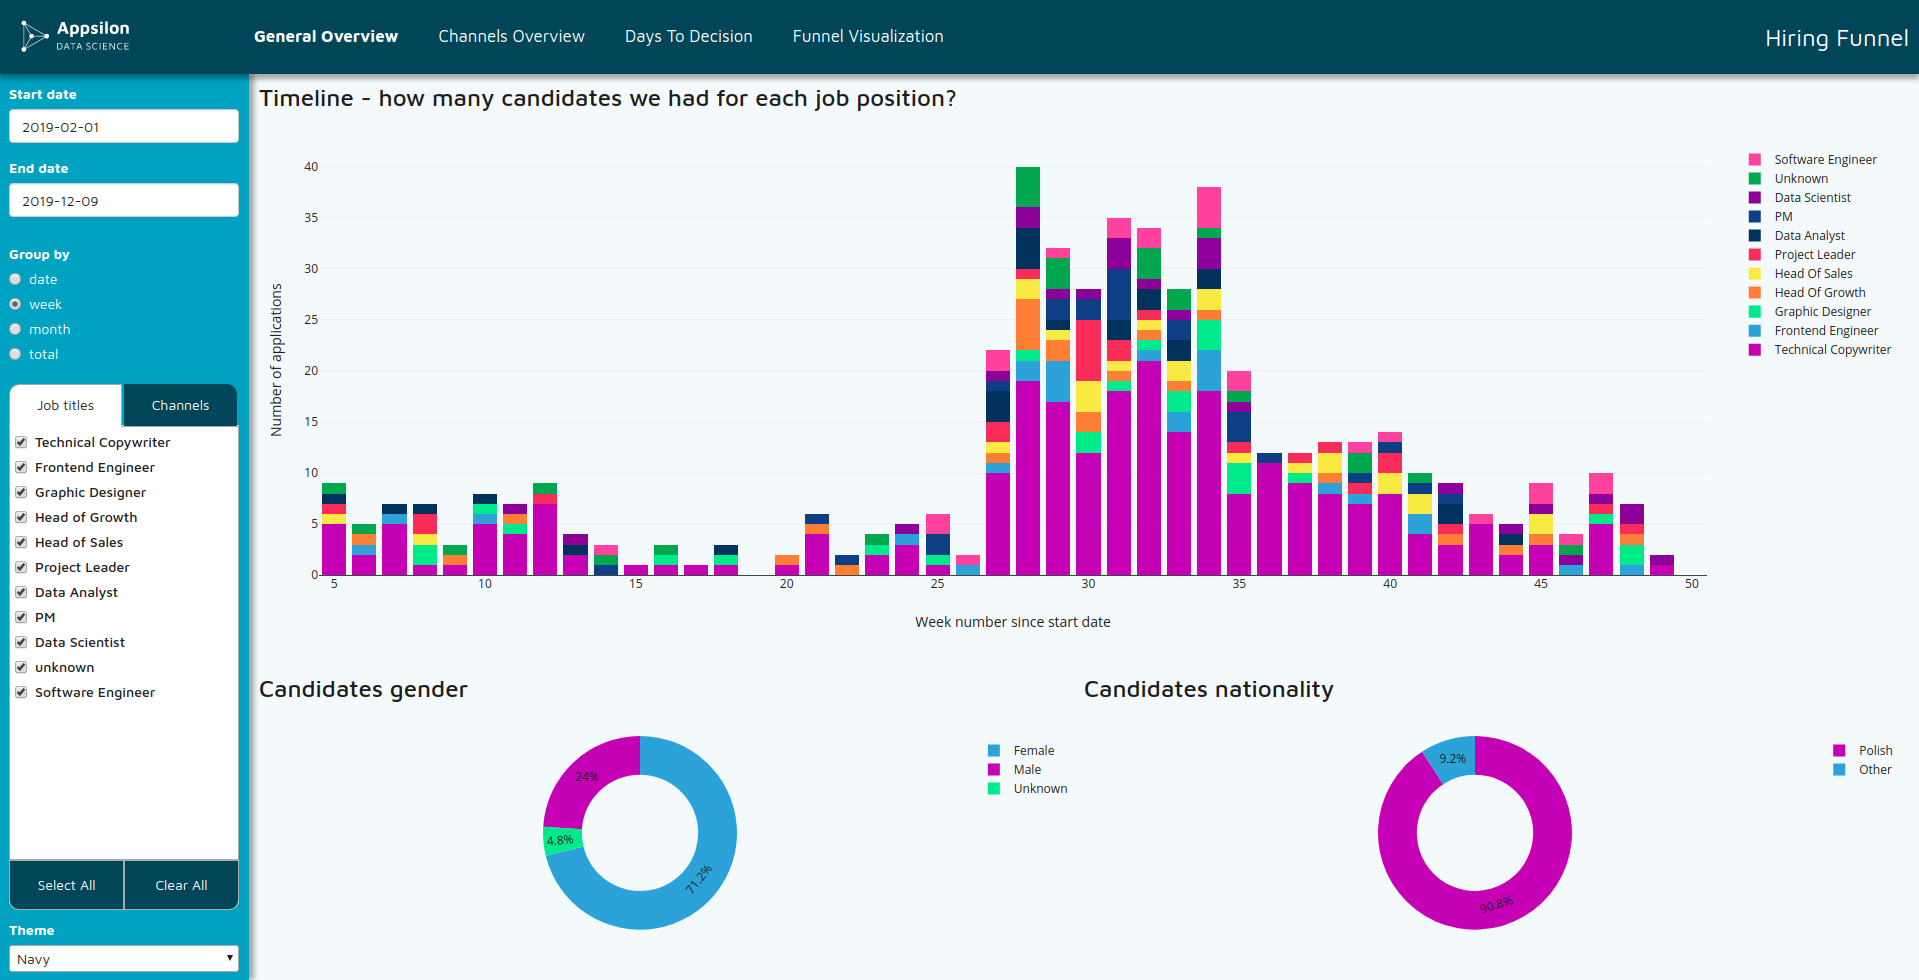
Image 4 – A fully custom dashboard
Also with dark mode:
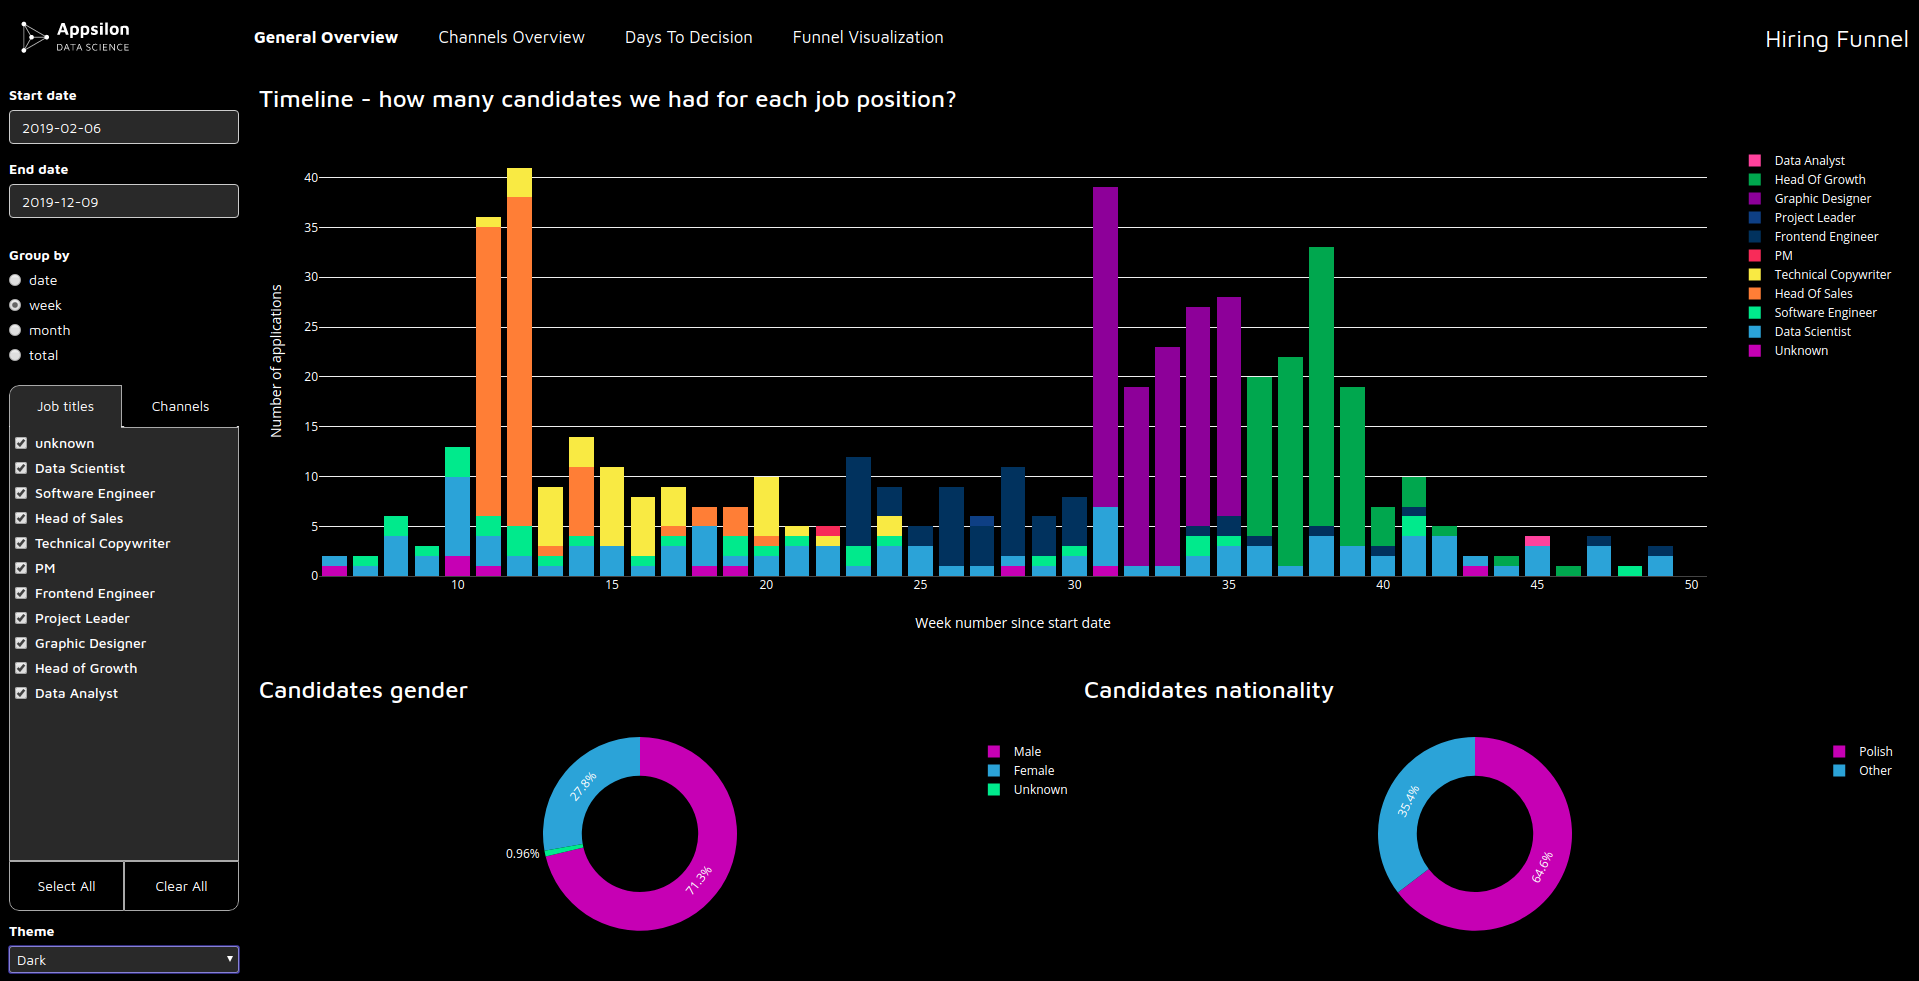
Image 5 – A fully custom dashboard with dark mode
Our approach included:
- Extended usage of CSS (in our case, SASS) for styling, layout, and themes
- Custom HTML elements using
shiny::tags - JavaScript for extra functionalities (Loading screens, custom tab behavior)
There’s a lot going on here so I will go over it in more detail in a future post about all of the different things that went into creating this dashboard. Still, it’s good to remember: no matter the complexity, a true custom solution is always possible.
Summary of R Shiny Dashboard Tutorial
And there you have it – Simple ways to make and tweak your R Shiny dashboards ranging from existing CSS solutions to custom ones. R Shiny makes integrating any existing framework a breeze, as all you have to is install the library and tweak a function call here and there.
What is your favorite package? Do you think it’s better to spend more time on custom solutions, or are the standard packages enough for you? Add your comments below.
Looking for more R Shiny tutorials?
We’ve got you covered:
- Video Tutorial: Create and Customize a Simple Shiny Dashboard
- How I built an interactive R Shiny dashboard in 2 days without any experience in R
- Tutorial: How I Built a Video Game in R Shiny
- How to Use CSS to Style Your R Shiny Dashboards
- How to Make Your CSS Systematically Awesome with SASS
References
- [shiny] (https://shiny.rstudio.com/)
- [shinydashboard] (https://rstudio.github.io/shinydashboard/)
- [semantic.dashboard] (https://github.com/Appsilon/semantic.dashboard/)
- [shiny.semantic] (https://github.com/Appsilon/shiny.semantic/)
- [Bootstrap] (https://getbootstrap.com/)
- [Semantic UI] (https://semantic-ui.com/)
Follow Appsilon on Social Media
- Follow @Appsilon on Twitter. Follow me @sparktuga
- Follow us on LinkedIn
- Sign up for our newsletter
- Try out our R Shiny open source packages
Contact Us
Project Manager

Get Updates
Subscribe to Shiny Weekly Newsletter
Join 4000+ Shiny enthusiasts to see the latest Shiny news from the R community.