Share
Share Tweet
Tweet Share
Share


R Shiny bslib – How to Work With Bootstrap Themes in Shiny

21 September 2022
R Shiny bslib is a package that makes working with Bootstrap themes a breeze. Let’s face it – Shiny apps look dull and mainstream by default. Not everyone has a keen eye for design, and sometimes spending days or weeks playing around with CSS isn’t an option. You need something that will look better, or at least brandable right now.
If that sounds like you, look no further than Bootstrap and bslib. Today you’ll learn all about it, from the basics to creating custom themes for R Shiny applications.
Could your Shiny app benefit from a little CSS? Here’s how to use TailwindCSS in R Shiny.
Table of contents:
- What is Bootstrap and R Shiny bslib?
- How to Make Bootstrap Themes with R Shiny bslib
- How to Add Bootstrap Themes to R Shiny
- Summary of R Shiny bslib
What is Bootstrap and R Shiny bslib?
In the most simple terms, Bootstrap is a free and open-source web development framework. It enables you to make responsive and mobile-first websites and apps with ease. Bootstrap provides a collection of styles you can use out of the box. For example, once you have Bootstrap configured, you only need to assign class attributes to HTML elements in order for styles to apply.
So, why would you want that? By using a prebuilt CSS framework, you can save hours, days, or even weeks by not writing the entire application style from scratch. Bootstrap is easy to use and comes with a predefined grid system, so your website will be responsive and mobile-friendly immediately (read: less or no media queries).
Now, Bootstrap isn’t a be-all-end-all solution. It provides you with everything you need to get started, but you should still know how to change colors, fonts, and others by yourself.
When it comes to R and R Shiny, you have two options if you want to use Bootstrap. You can either download the framework and embed it into your app, or you can use an R package such as bslib to do most of the heavy lifting for you.
But what is bslib? This R package provides tools for customizing Bootstrap themes directly in R, and it primarily targets Shiny apps and R Markdown documents.
To use it, you’ll first need to install it:
install.packages("bslib")Let’s see how you can use bslib next.
How to Make Bootstrap Themes with R Shiny bslib
What’s neat about bslib is that you don’t have to download any specific version of Bootstrap manually – you can specify versions 3, 4, or 5 straight from R.
To get your hands dirty with your first theme, simply store the results of a bs_theme() function call to a variable. The only parameter we’ll specify for now is version, and we’ll set it to 5. It instructs bslib to use the latest version of Bootstrap, or Bootstrap 5:
library(bslib)

first_bs5_theme <- bs_theme(
    version = 5
)
first_bs5_theme
Here are the contents of first_bs5_theme:
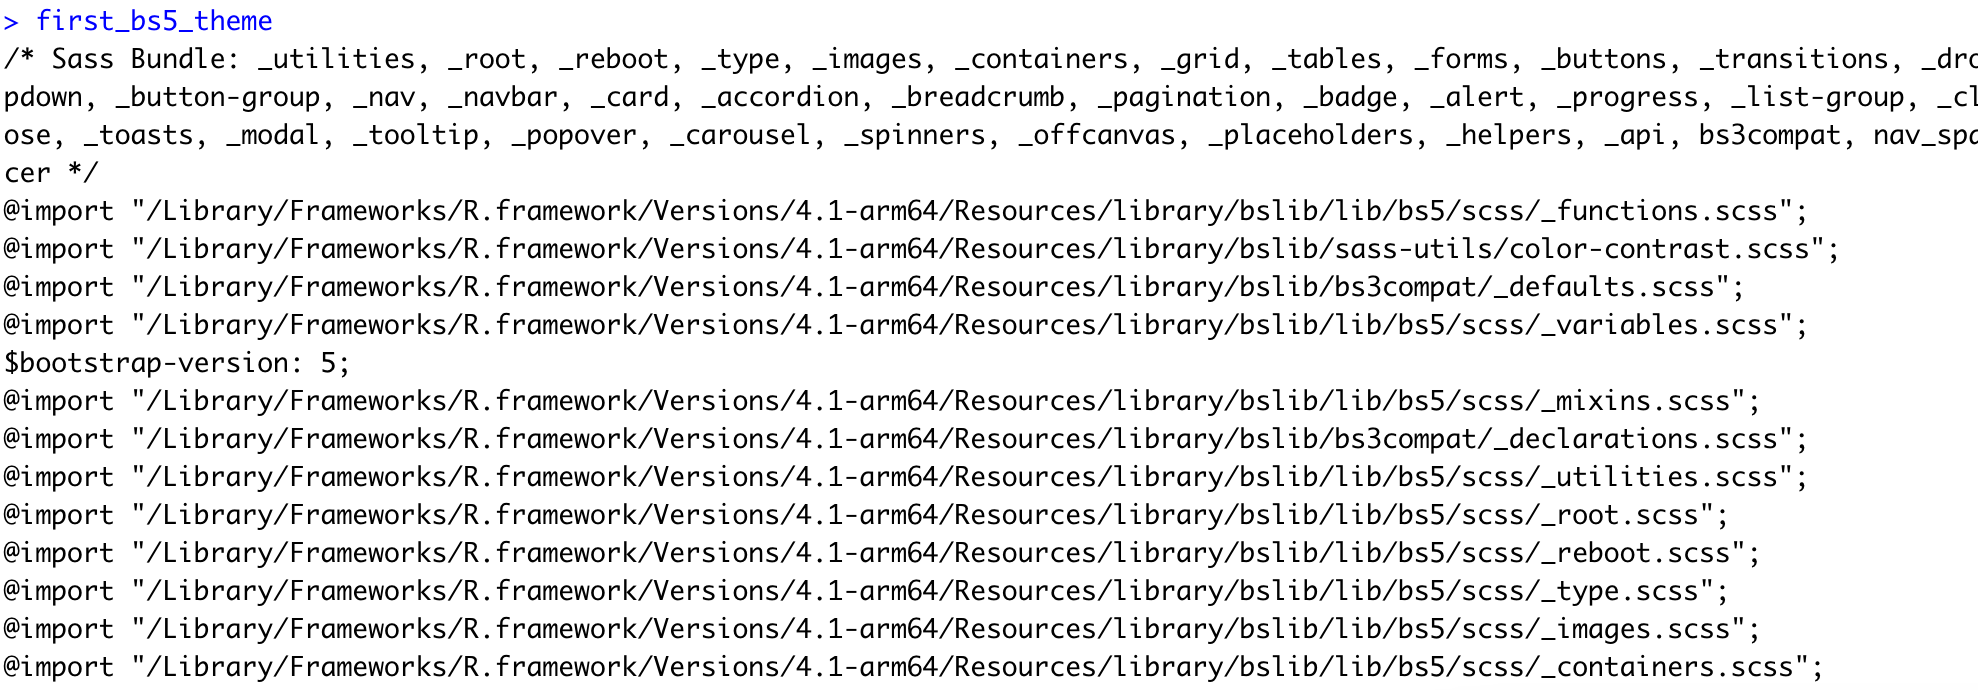
Image 1 – Contents of a variable containing a Bootstrap theme
This doesn’t tell us much, sure. It would be a lot nicer to preview the theme. The bs_theme_preview() function will create a boilerplate R Shiny bslib application around your theme. That app will showcase most of the Bootstrap elements that are relevant to R Shiny. For now, we’ll also set with_themer = FALSE to avoid extra confusion – it will be covered and explained later:
library(bslib)

first_bs5_theme <- bs_theme(
    version = 5
)
bs_theme_preview(theme = first_bs5_theme, with_themer = FALSE)
Below are a couple of images from the first three tabs of the Shiny app:
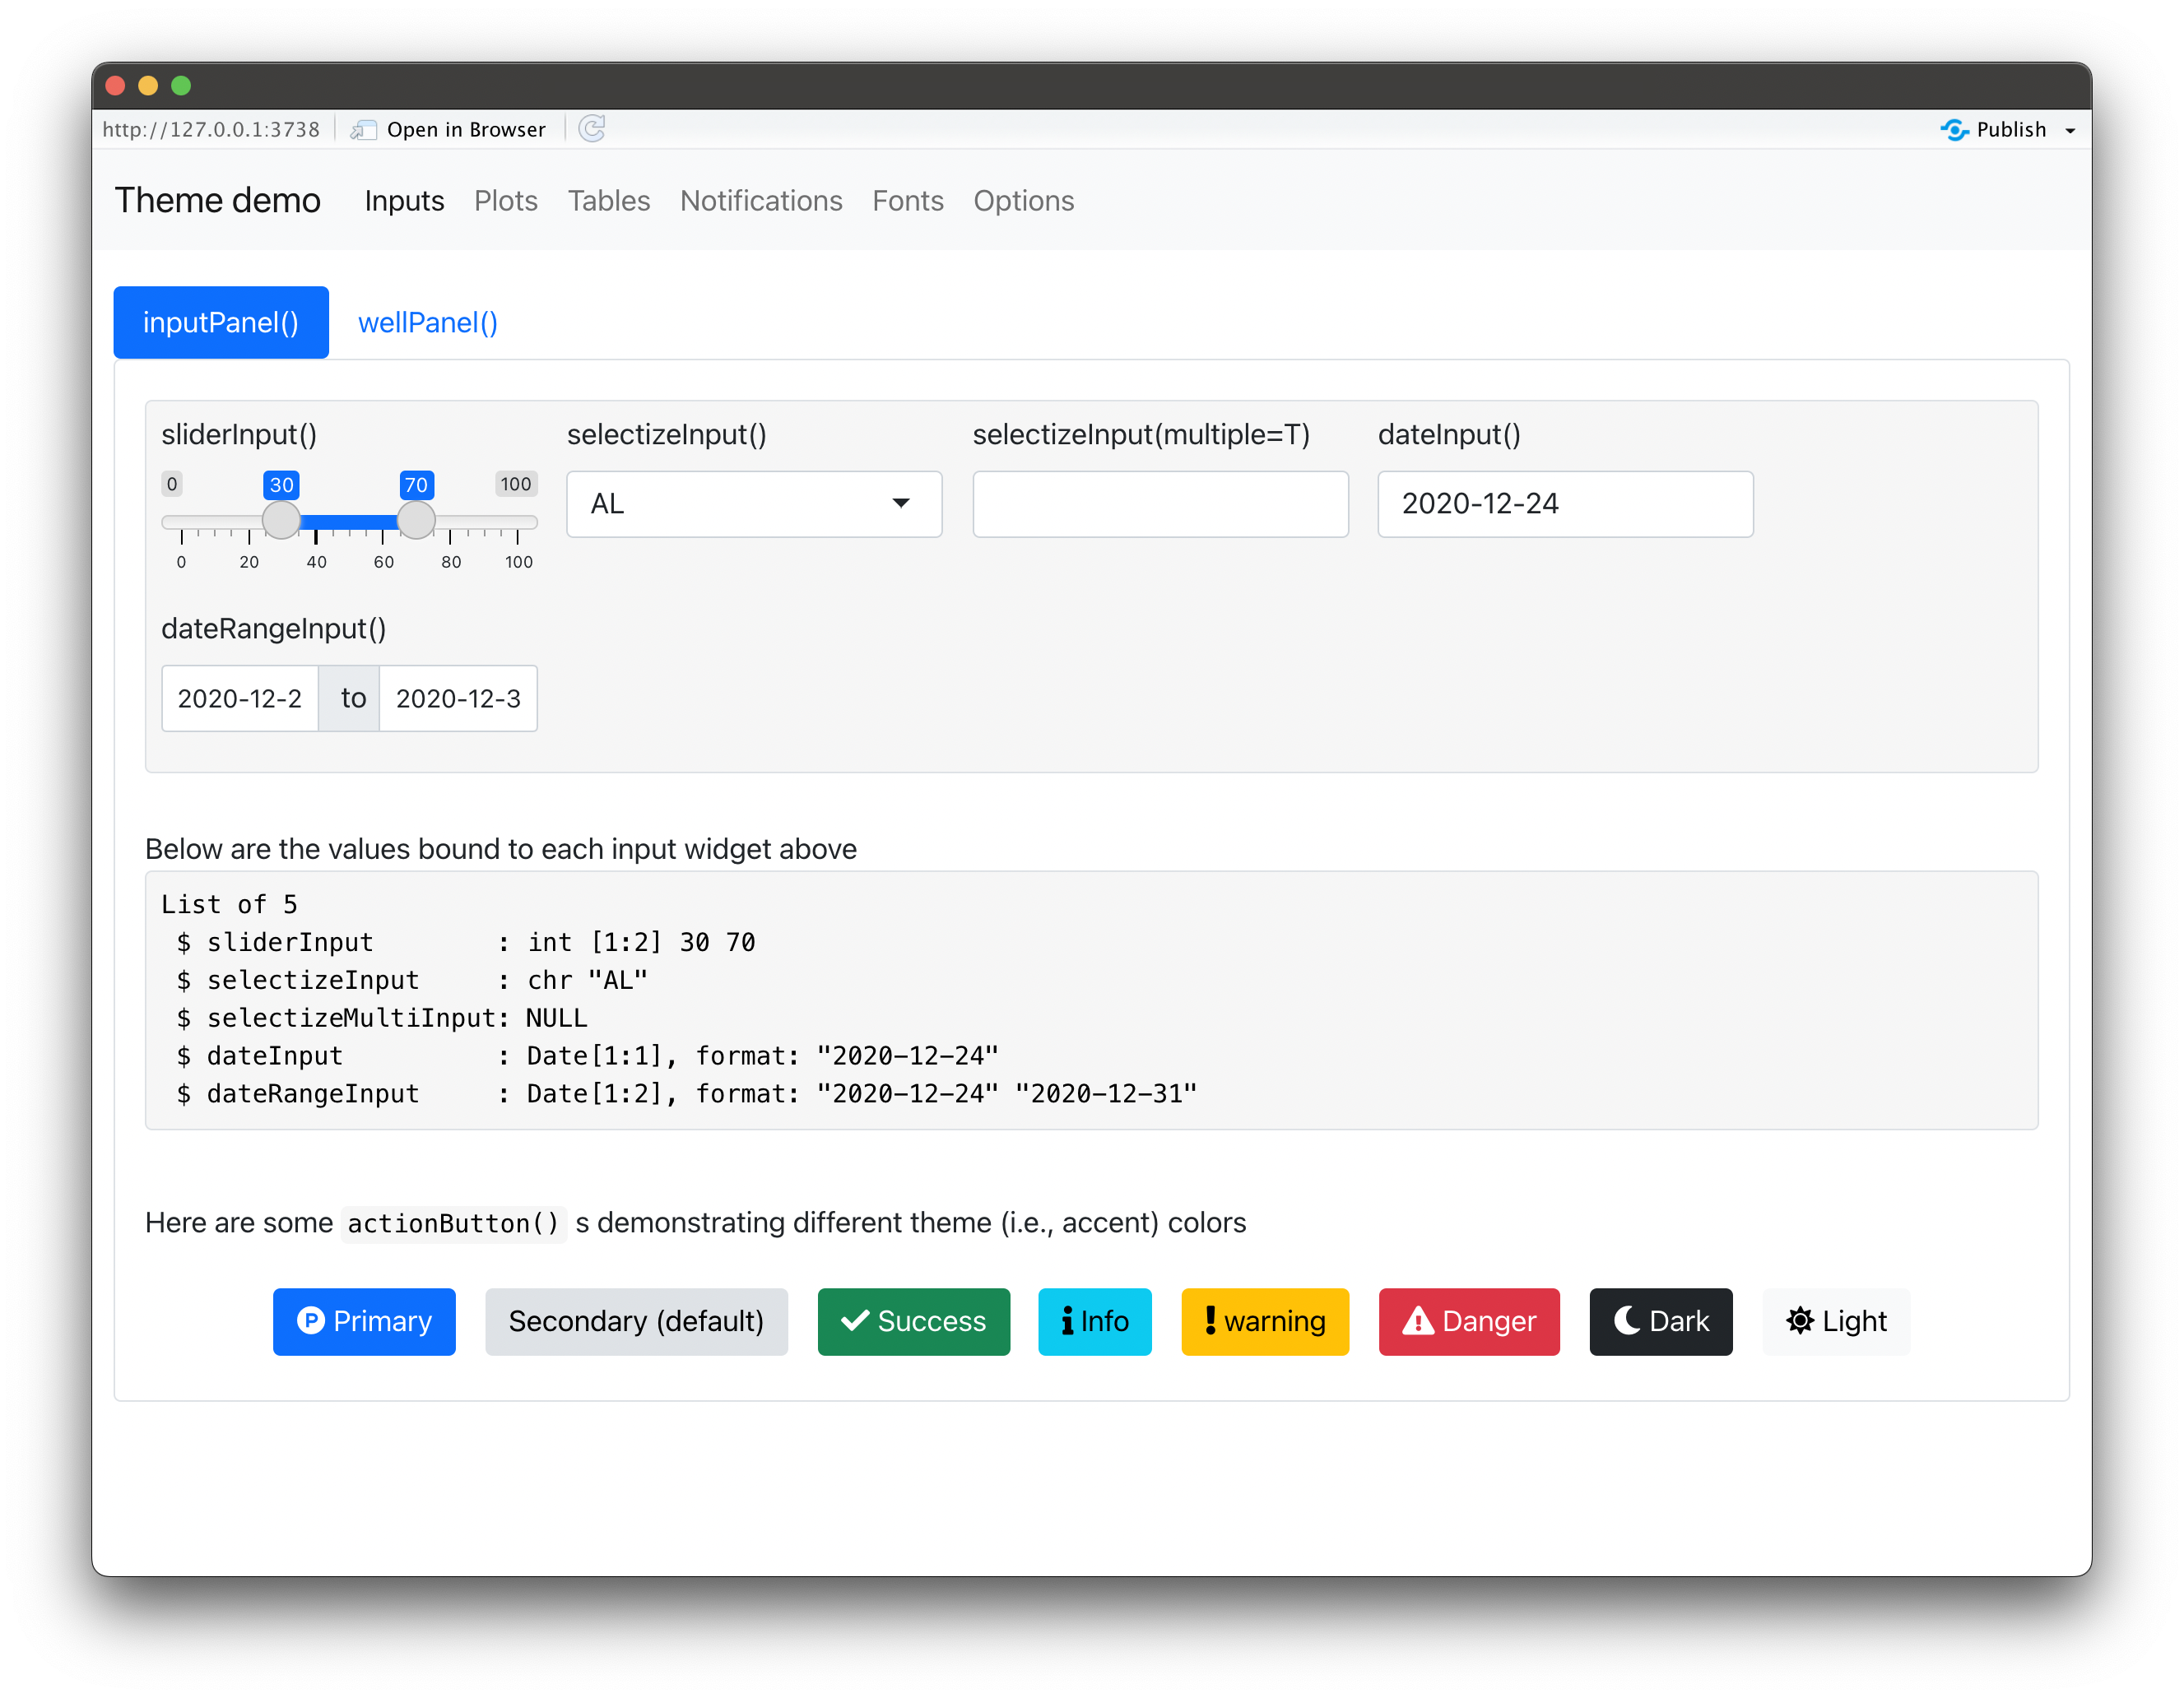
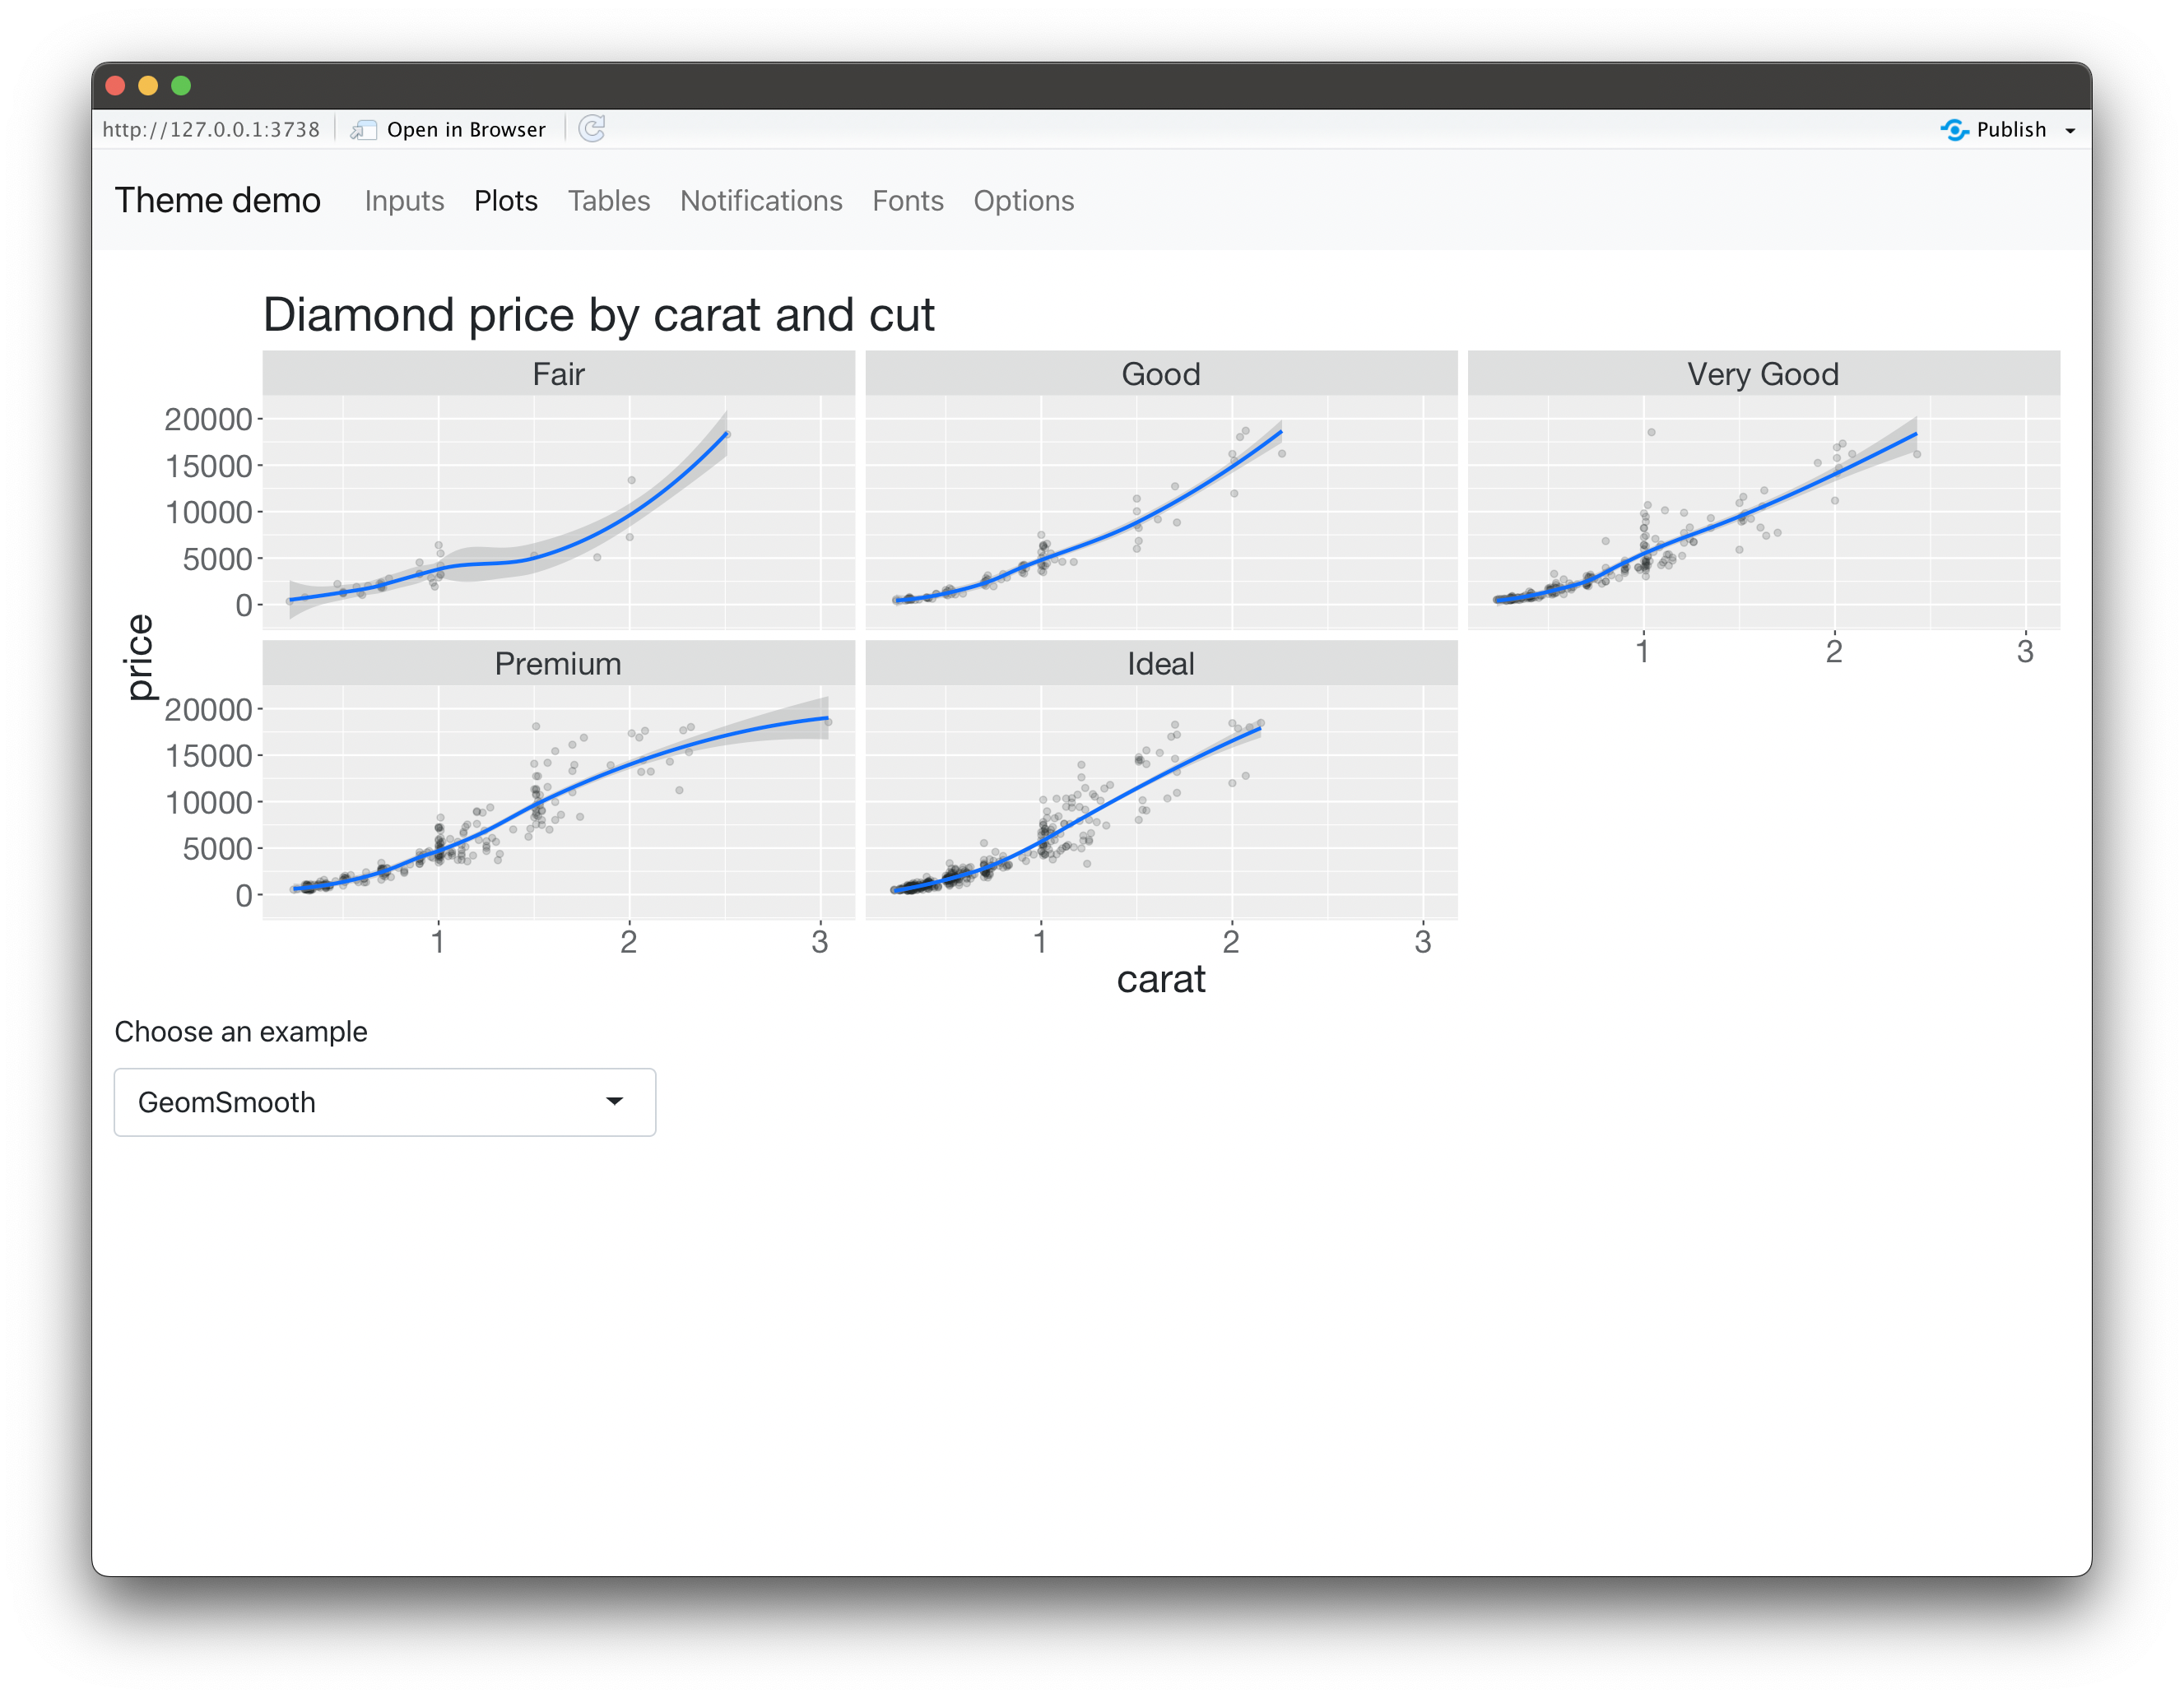
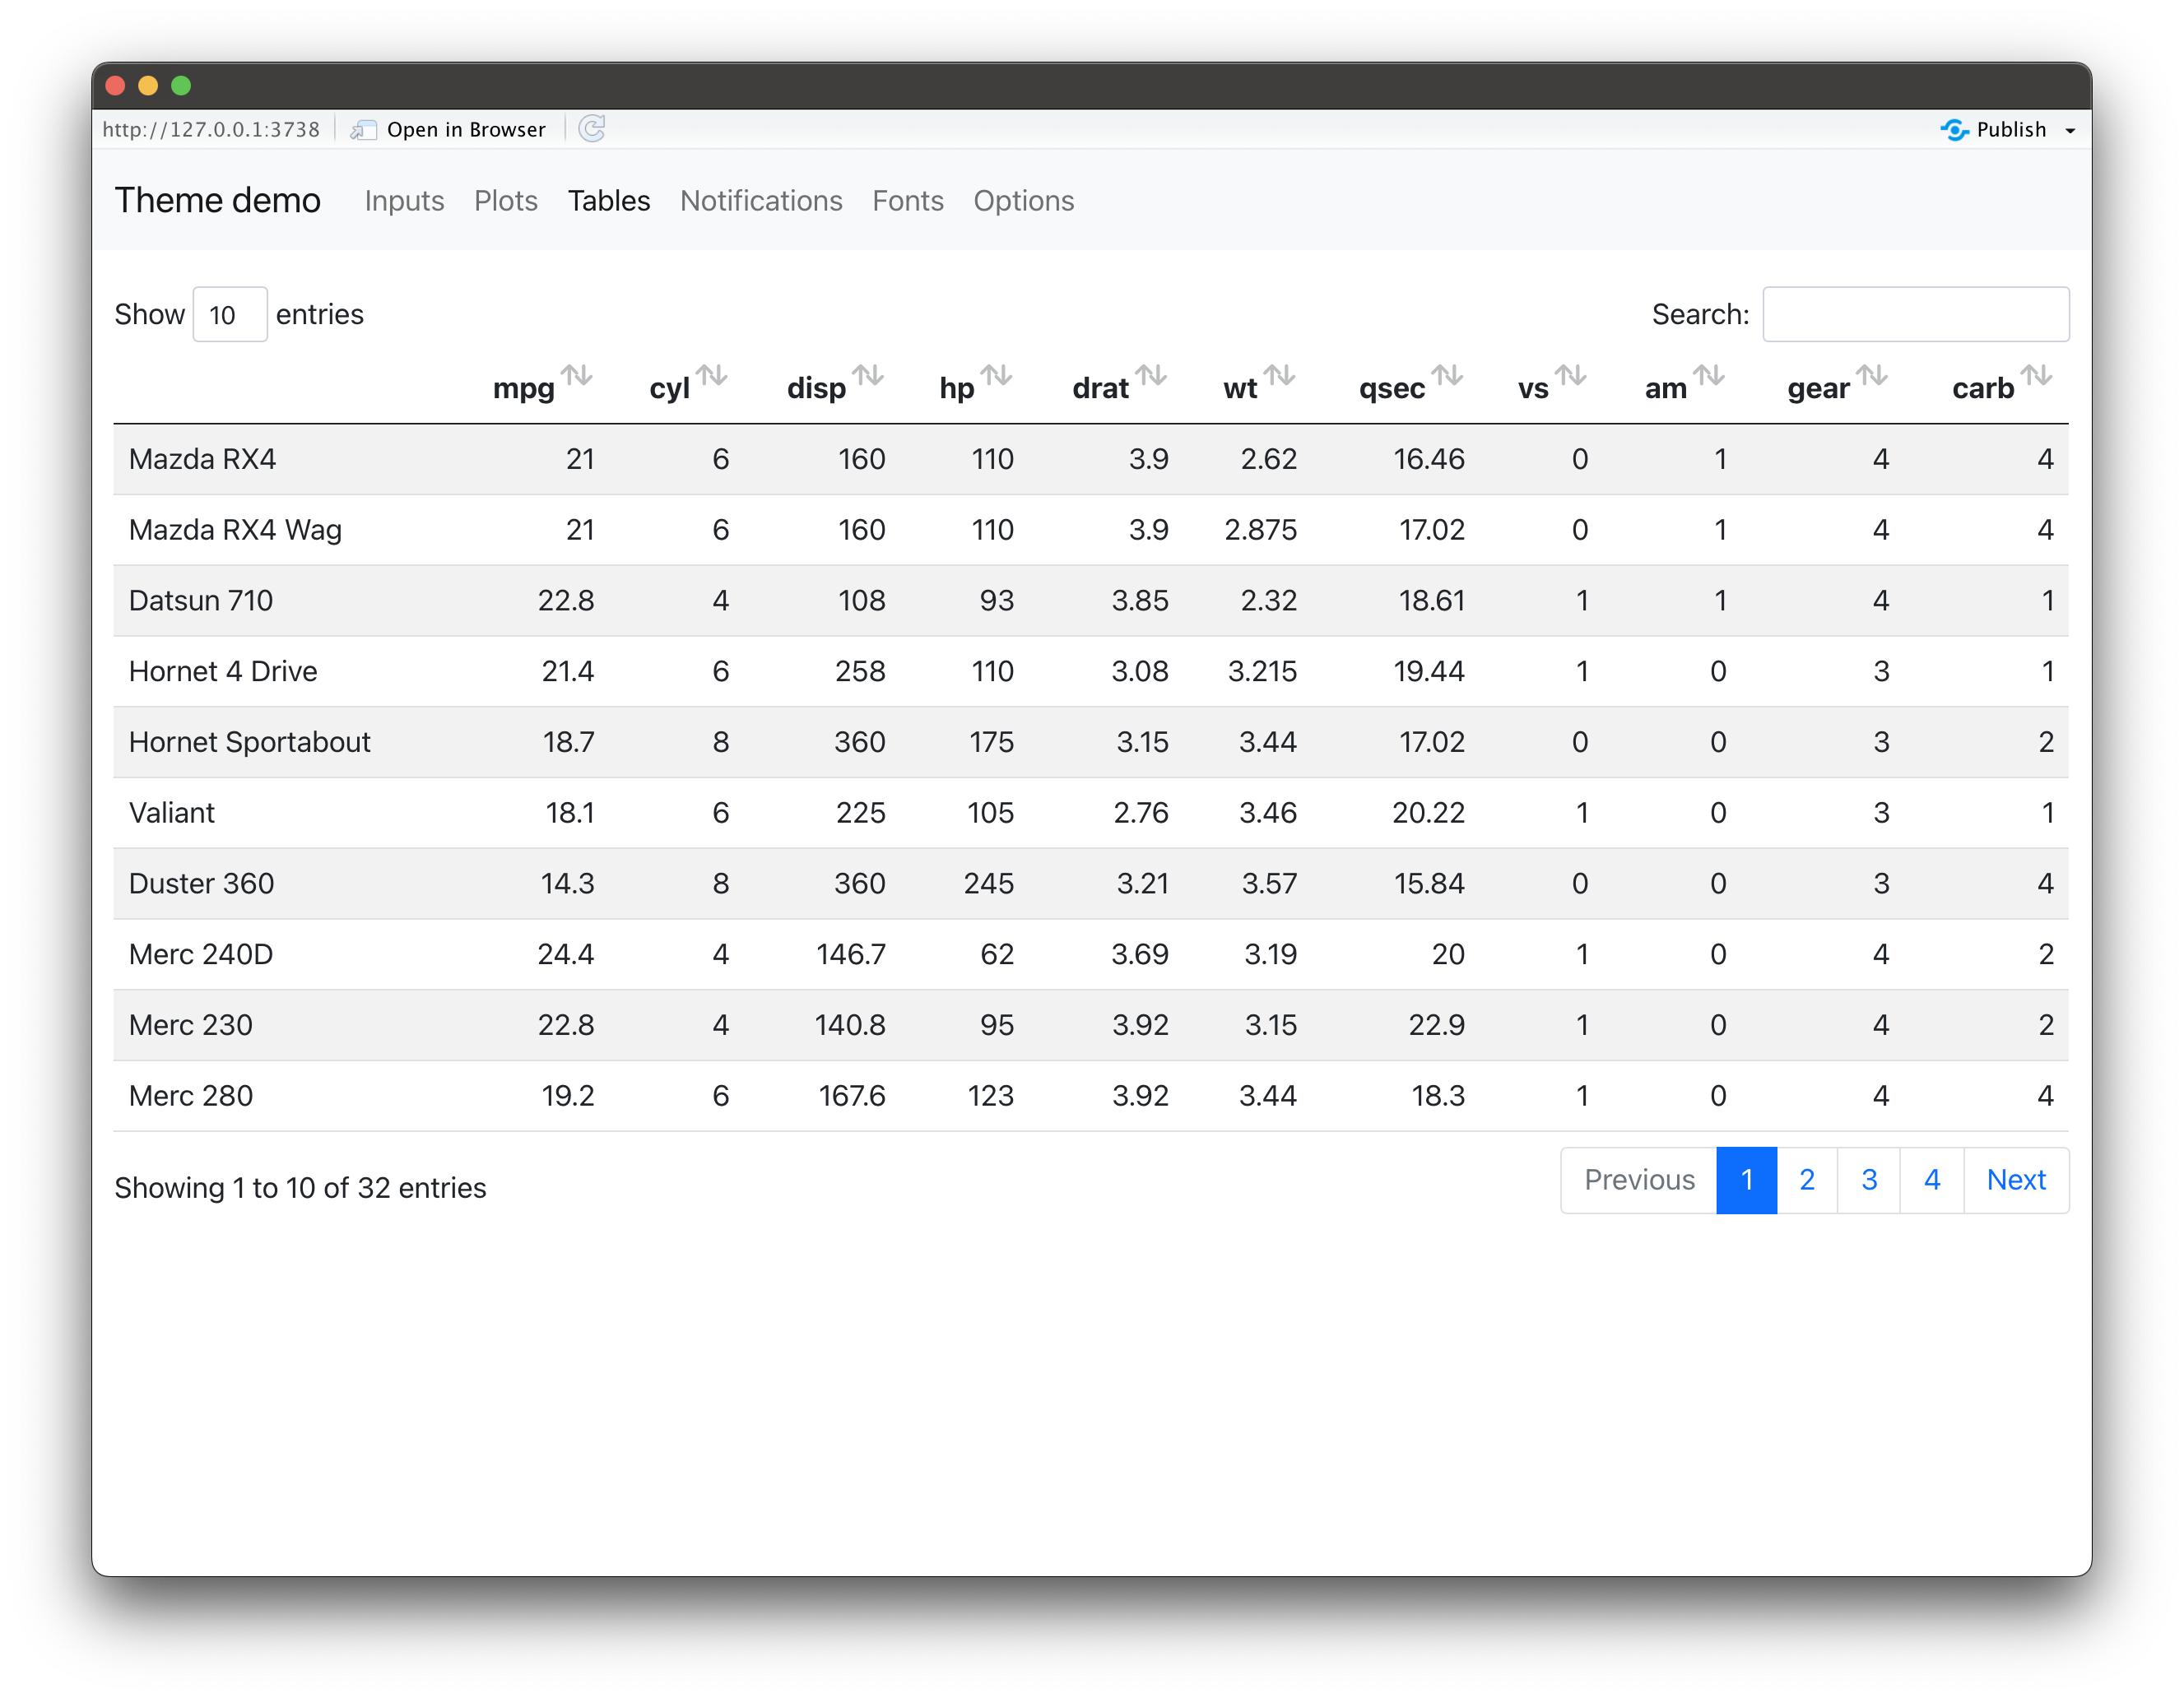
Neat, right? That’s one way to style your R Shiny applications, but the story doesn’t end here. There are many parameters you can pass to bs_theme(), and you can grab the full list in the official documentation.
For demonstration, we’ll show you how to modify background, foreground, primary, and secondary colors, and also how to change the base font of the theme:
library(bslib)
custom_theme <- bs_theme(
version = 5,
bg = "#FFFFFF",
fg = "#000000",
primary = "#0199F8",
secondary = "#FF374B",
base_font = "Maven Pro"
)
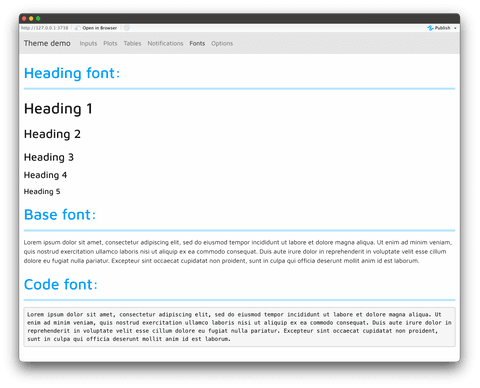
bs_theme_preview(theme = custom_theme, with_themer = FALSE)The Fonts tab of the preview application best demonstrates how the styles were tweaked:
Image 5 – Example Shiny app with custom font and colors
Now we’re getting somewhere. You know how to use bslib to create custom themes, but there’s still one important question to answer – How can you add custom Bootstrap themes to your R Shiny apps? Let’s answer that next.
How to Add Bootstrap Themes to R Shiny
To keep things to the point, we’ll borrow the R Shiny app code from our Top 3 Tools to Monitor User Adoption in R Shiny article. It lets you specify columns of the Iris dataset on which then a clustering algorithm is applied:
library(shiny)


ui <- fluidPage(
    headerPanel("Iris k-means clustering"),
    sidebarLayout(
        sidebarPanel(
            selectInput(
                inputId = "xcol",
                label = "X Variable",
                choices = names(iris)
            ),
            selectInput(
                inputId = "ycol",
                label = "Y Variable",
                choices = names(iris),
                selected = names(iris)[[2]]
            ),
            numericInput(
                inputId = "clusters",
                label = "Cluster count",
                value = 3,
                min = 1,
                max = 9
            )
        ),
        mainPanel(
            plotOutput("plot1")
        )
    )
)


server <- function(input, output, session) {
    selectedData <- reactive({
        iris[, c(input$xcol, input$ycol)]
    })
    clusters <- reactive({
        kmeans(selectedData(), input$clusters)
    })
    output$plot1 <- renderPlot({
        palette(c(
            "#E41A1C", "#377EB8", "#4DAF4A", "#984EA3",
            "#FF7F00", "#FFFF33", "#A65628", "#F781BF", "#999999"
        ))

        par(mar = c(5.1, 4.1, 0, 1))
        plot(selectedData(),
            col = clusters()$cluster,
            pch = 20, cex = 3
        )
        points(clusters()$centers, pch = 4, cex = 4, lwd = 4)
    })
}


shinyApp(ui = ui, server = server)
If you’re wondering, here’s how the app looks:
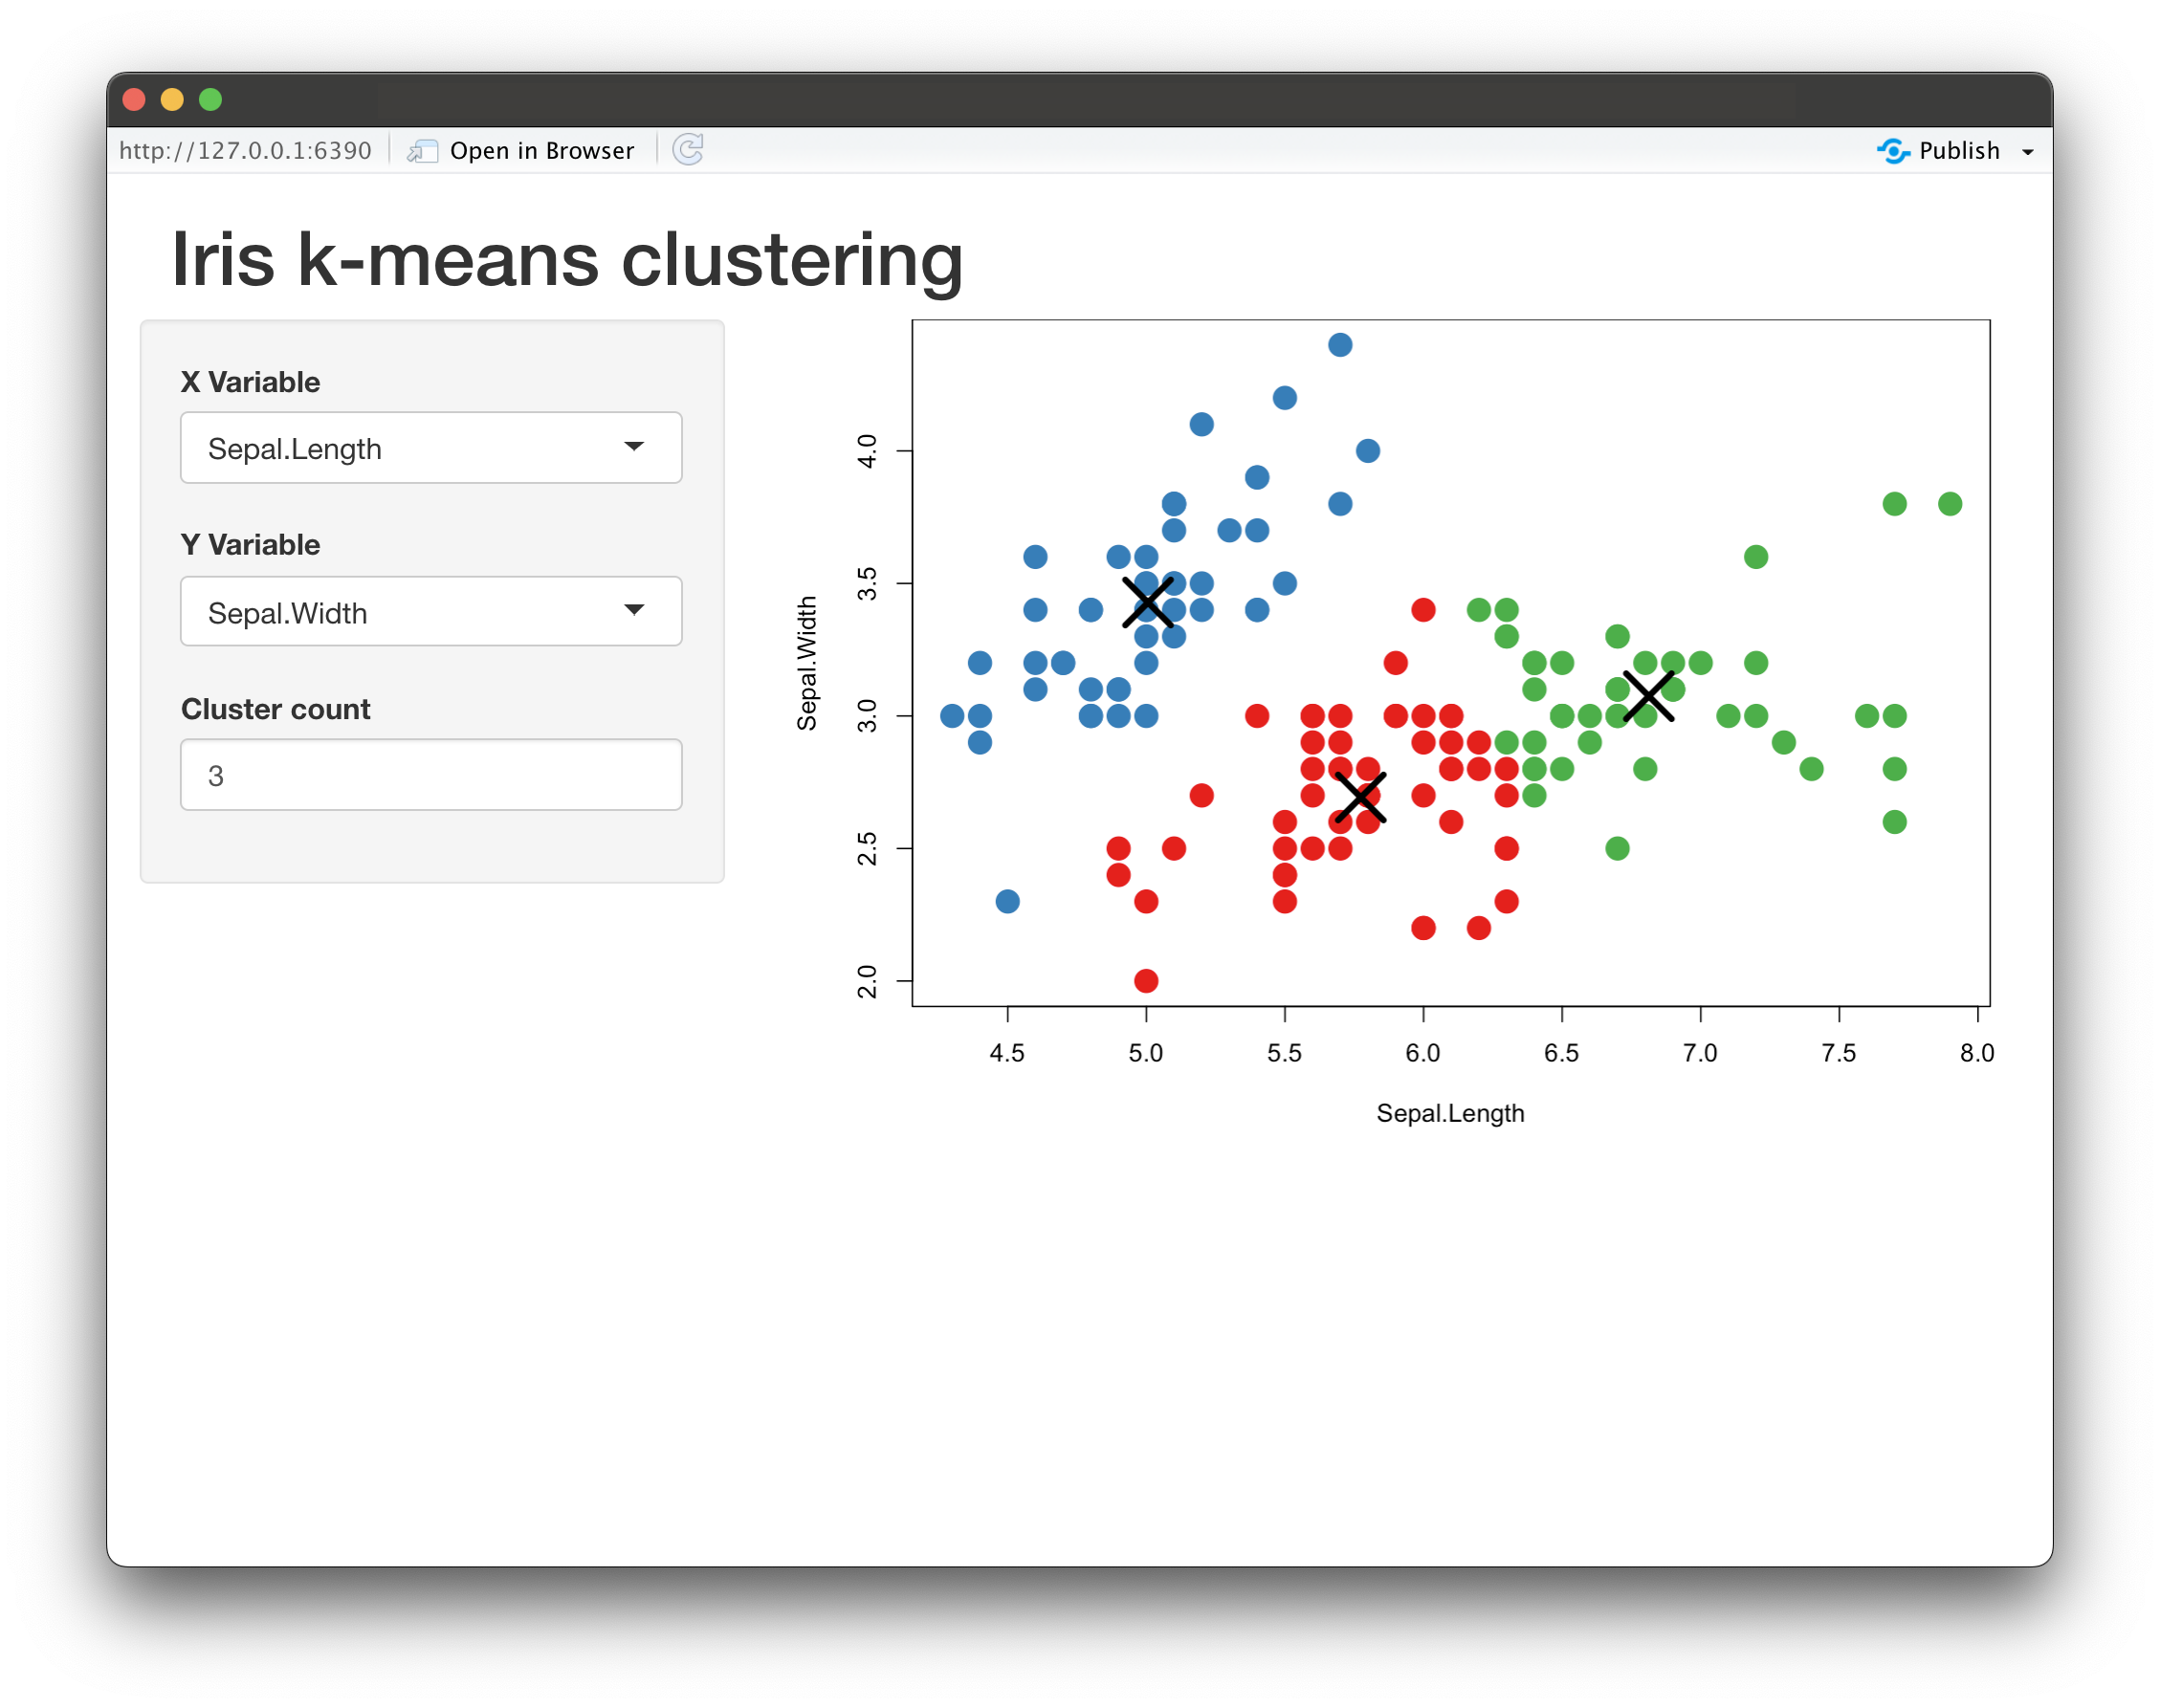
Image 6 – Basic R Shiny clustering app
To add a custom Bootstrap theme, you’ll have to:
- Import the
bslibpackage. - Add the code for your theme (
custom_theme). - Add a
themeargument to Shiny UI. - Wrap
shinyApp(ui = ui, server = server)with another function –run_with_themer().
That’s all! Below is the full source code if you got lost in the process:
library(shiny)
library(bslib)
custom_theme <- bs_theme(
version = 5,
bg = "#FFFFFF",
fg = "#000000",
primary = "#0199F8",
secondary = "#FF374B",
base_font = "Maven Pro"
)
ui <- fluidPage(
theme = custom_theme,
headerPanel("Iris k-means clustering"),
sidebarLayout(
sidebarPanel(
selectInput(
inputId = "xcol",
label = "X Variable",
choices = names(iris)
),
selectInput(
inputId = "ycol",
label = "Y Variable",
choices = names(iris),
selected = names(iris)[[2]]
),
numericInput(
inputId = "clusters",
label = "Cluster count",
value = 3,
min = 1,
max = 9
)
),
mainPanel(
plotOutput("plot1")
)
)
)
server <- function(input, output, session) {
selectedData <- reactive({
iris[, c(input$xcol, input$ycol)]
})
clusters <- reactive({
kmeans(selectedData(), input$clusters)
})
output$plot1 <- renderPlot({
palette(c(
"#E41A1C", "#377EB8", "#4DAF4A", "#984EA3",
"#FF7F00", "#FFFF33", "#A65628", "#F781BF", "#999999"
))
par(mar = c(5.1, 4.1, 0, 1))
plot(selectedData(),
col = clusters()$cluster,
pch = 20, cex = 3
)
points(clusters()$centers, pch = 4, cex = 4, lwd = 4)
})
}
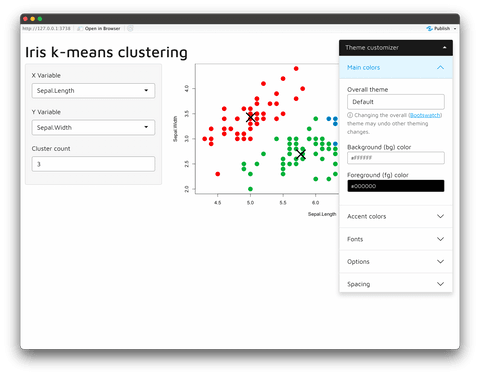
run_with_themer(shinyApp(ui = ui, server = server))The themed Shiny app looks like this:
Image 7 – Themed R Shiny clustering app
You can notice how we didn’t specify with_themer = FALSE this time. Because of that, you can tweak the theme parameters on the fly. For example, you can change the Overall theme from Default to Darkly:
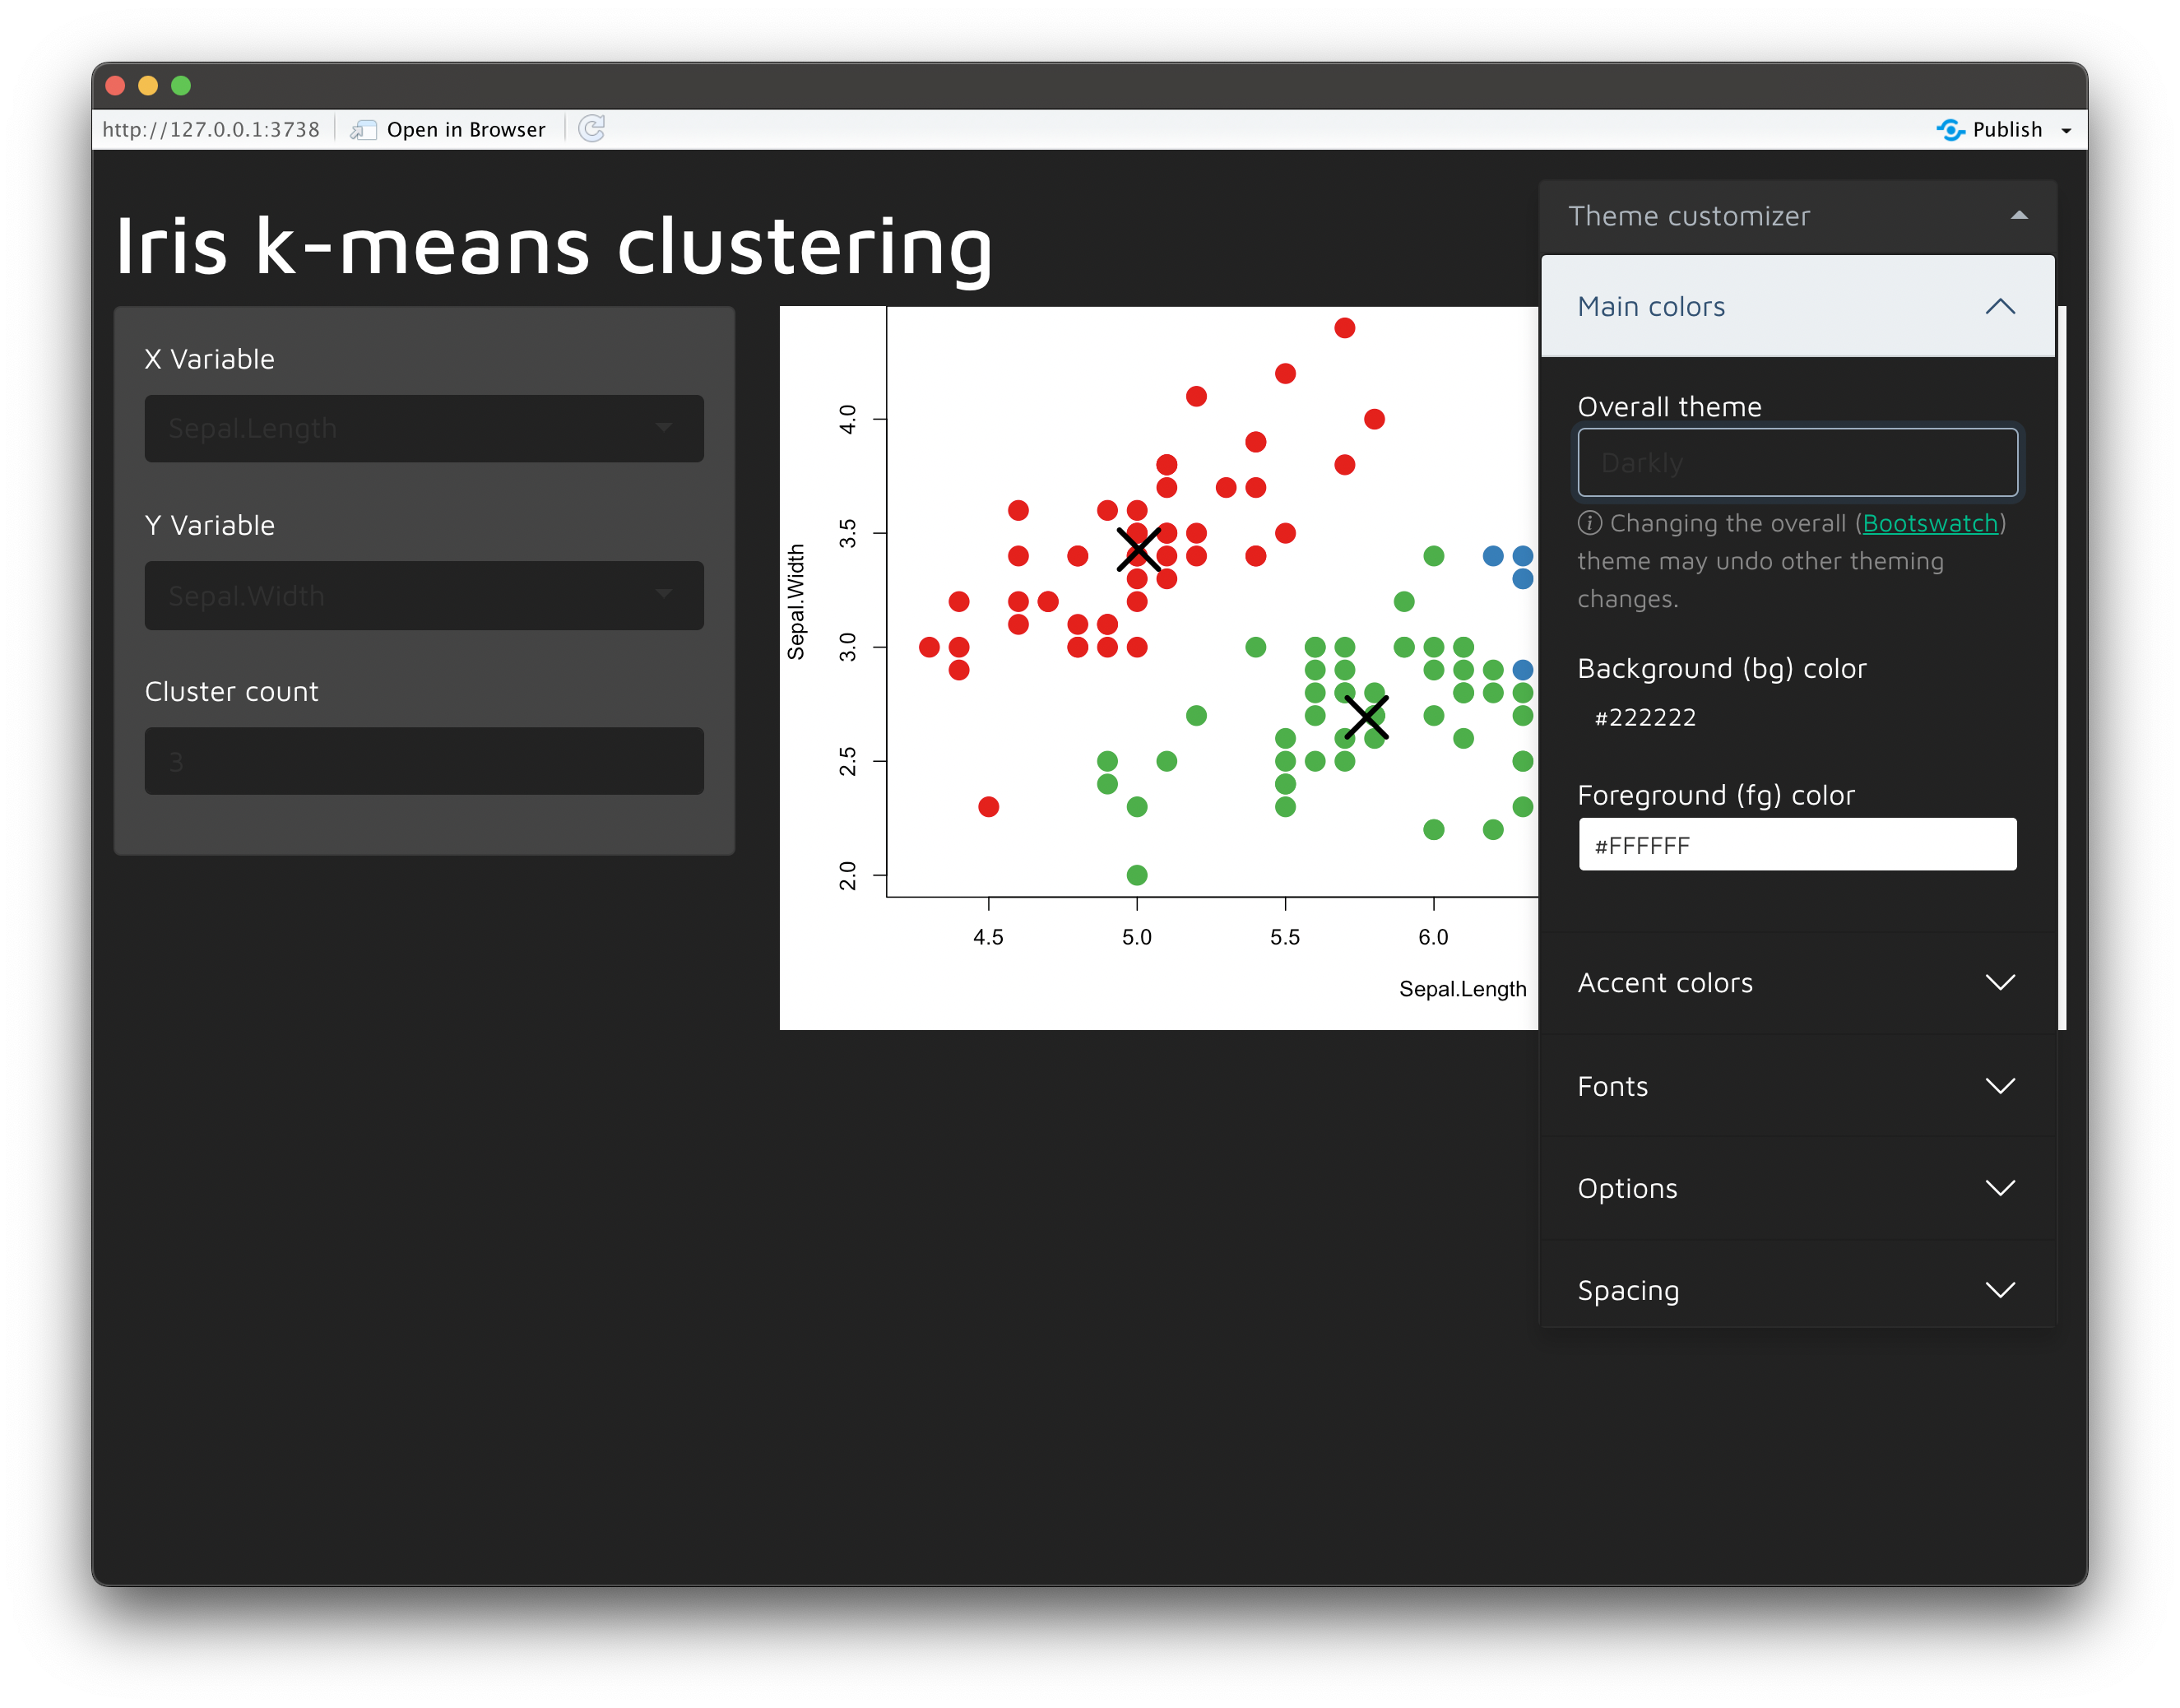
Image 8 – Changing the overall theme
The best way to see the theme was changed is in the text. We’re using Maven Pro for all textual elements, which is noticeable if you expand the dropdown menu:
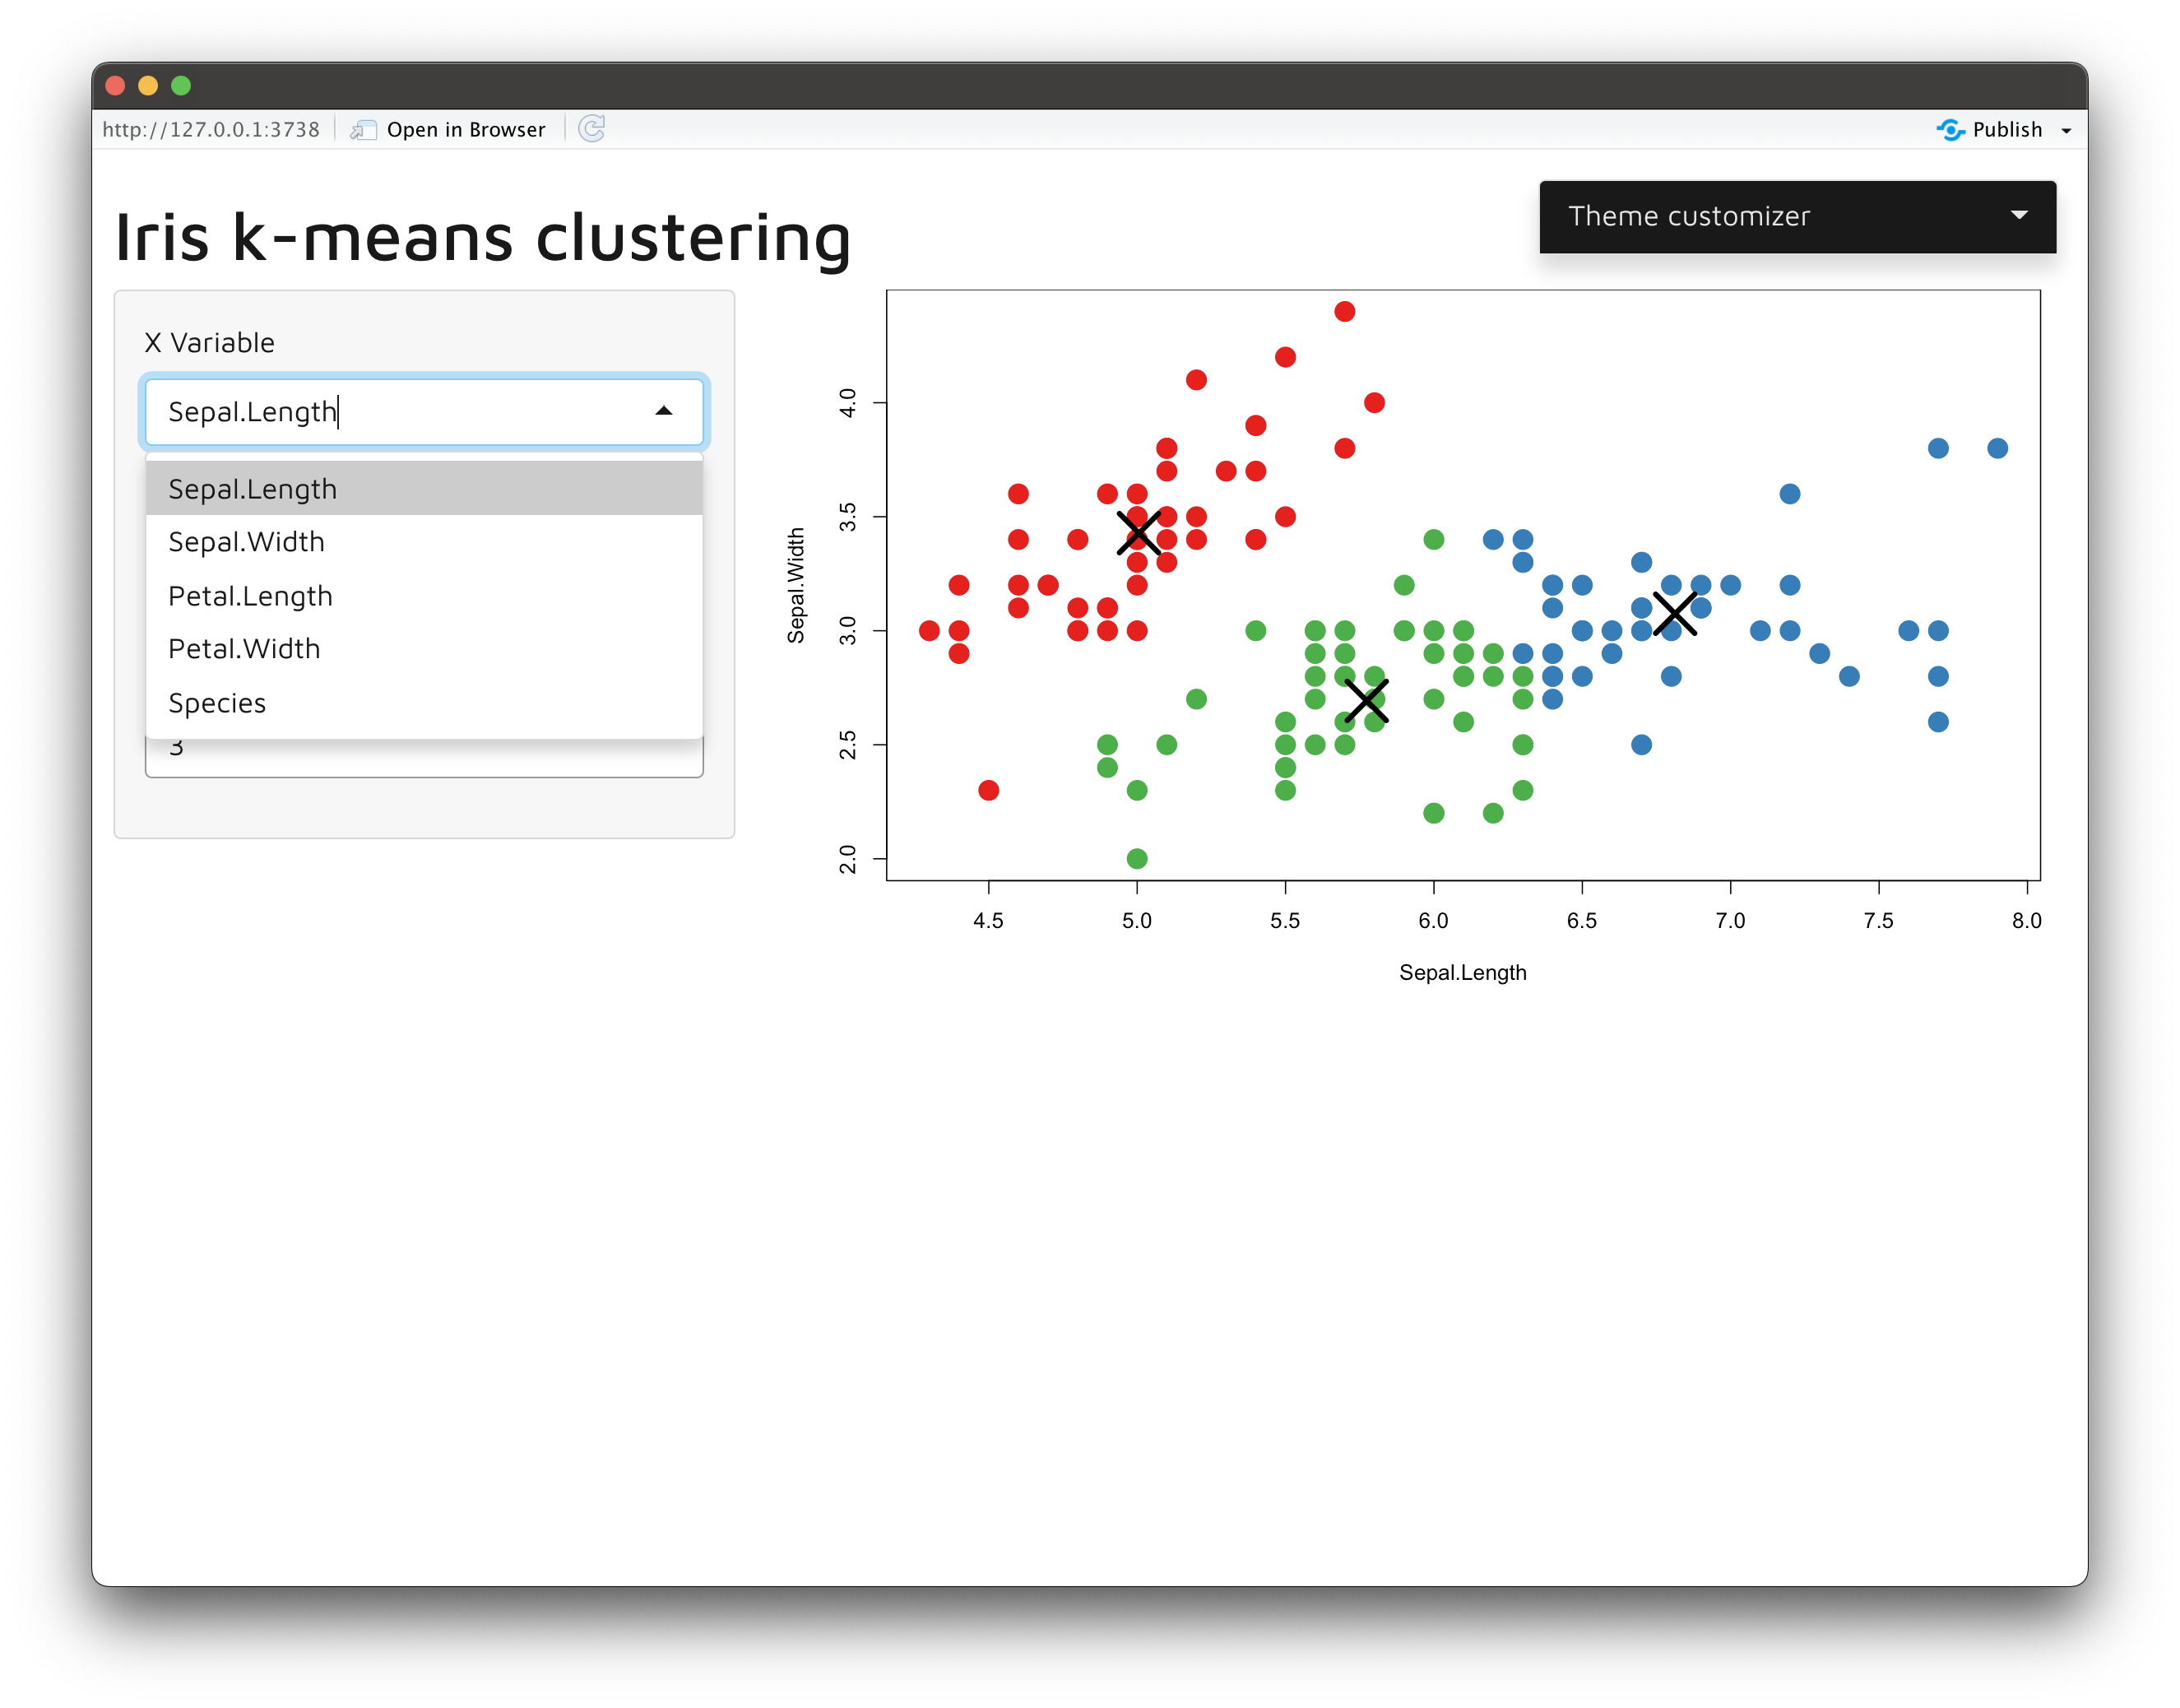
Image 9 – Examining the app font
And that’s everything you need to use R Shiny bslib. There are many other theme parameters you can change, but we’ll leave the exploration up to you.
Summary of R Shiny bslib
Today you’ve learned how to work with Bootstrap 5 themes in R Shiny, and how to customize these themes straight from R. There’s no need to download Bootstrap CSS/JS files and embed them into your dashboard, as this package does everything for you. Using and customizing a theme boils down to adding a couple of additional function calls to your existing R Shiny dashboard. It’s that simple.
Now it’s time for you to shine. For a homework assignment, we recommend you research and use other bs_theme() parameters and come up with a fully-customized theme. Give it a go, and make sure to share your before/after shots with us on Twitter – @appsilon. We’d love to see what you come up with.
Looking for an inspiration for your next R Shiny project? Take a look at these 7 examples of R Shiny dashboards in life sciences.
Contact Us
Project Manager

Get Updates
Subscribe to Shiny Weekly Newsletter
Join 4000+ Shiny enthusiasts to see the latest Shiny news from the R community.