Share
Share Tweet
Tweet Share
Share


How To Connect R Shiny to Postgres Database – The Definitive Guide

11 January 2022
Managing database connections can be messy at times. It’s always easier to read and write to local CSV files. That doesn’t mean it’s the right thing to do, as most production environments have data stored in one or multiple databases. As a data professional, you must know how to connect to different databases through different programming languages.
Today you’ll learn how to connect R and R Shiny to the Postgres database – one of the most well-known open-source databases. There’s no better way to learn than through a hands-on example, so you’ll also create a fully-working interactive dashboard with R Shiny.
We assume you already have the Postgres database installed, as well as a GUI management tool like pgAdmin. Installation is OS-specific, so we won’t go through that today. You can Google the installation steps – it shouldn’t take more than a couple of minutes.
Looking for a career switch? Here’s how to start a career as an R Shiny developer.
Table of contents:
- Load Data Into Postgres Database
- Connect R to Postgres Database
- Connect R Shiny to Postgres and Create a Dashboard
- Conclusion
Load Data Into Postgres Database
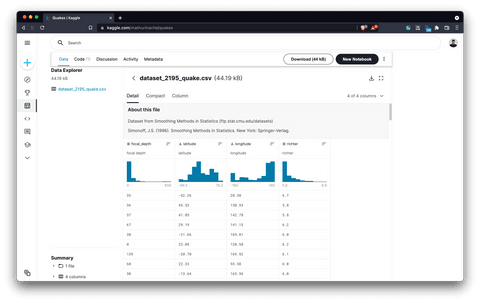
As our data source, we’ll use the Quakes dataset from Kaggle. Download it as a CSV file – we’ll load it into the Postgres database shortly:
Image 1 – Quakes dataset from Kaggle
We’ve chosen this dataset deliberately because it has only four columns. This way, the time spent importing it into the Postgres database is minimal.
To start, create a new table using the following SQL query. We’ve named ours earthquakes:
Once created, right-click on the table name and select the Import/Export option:
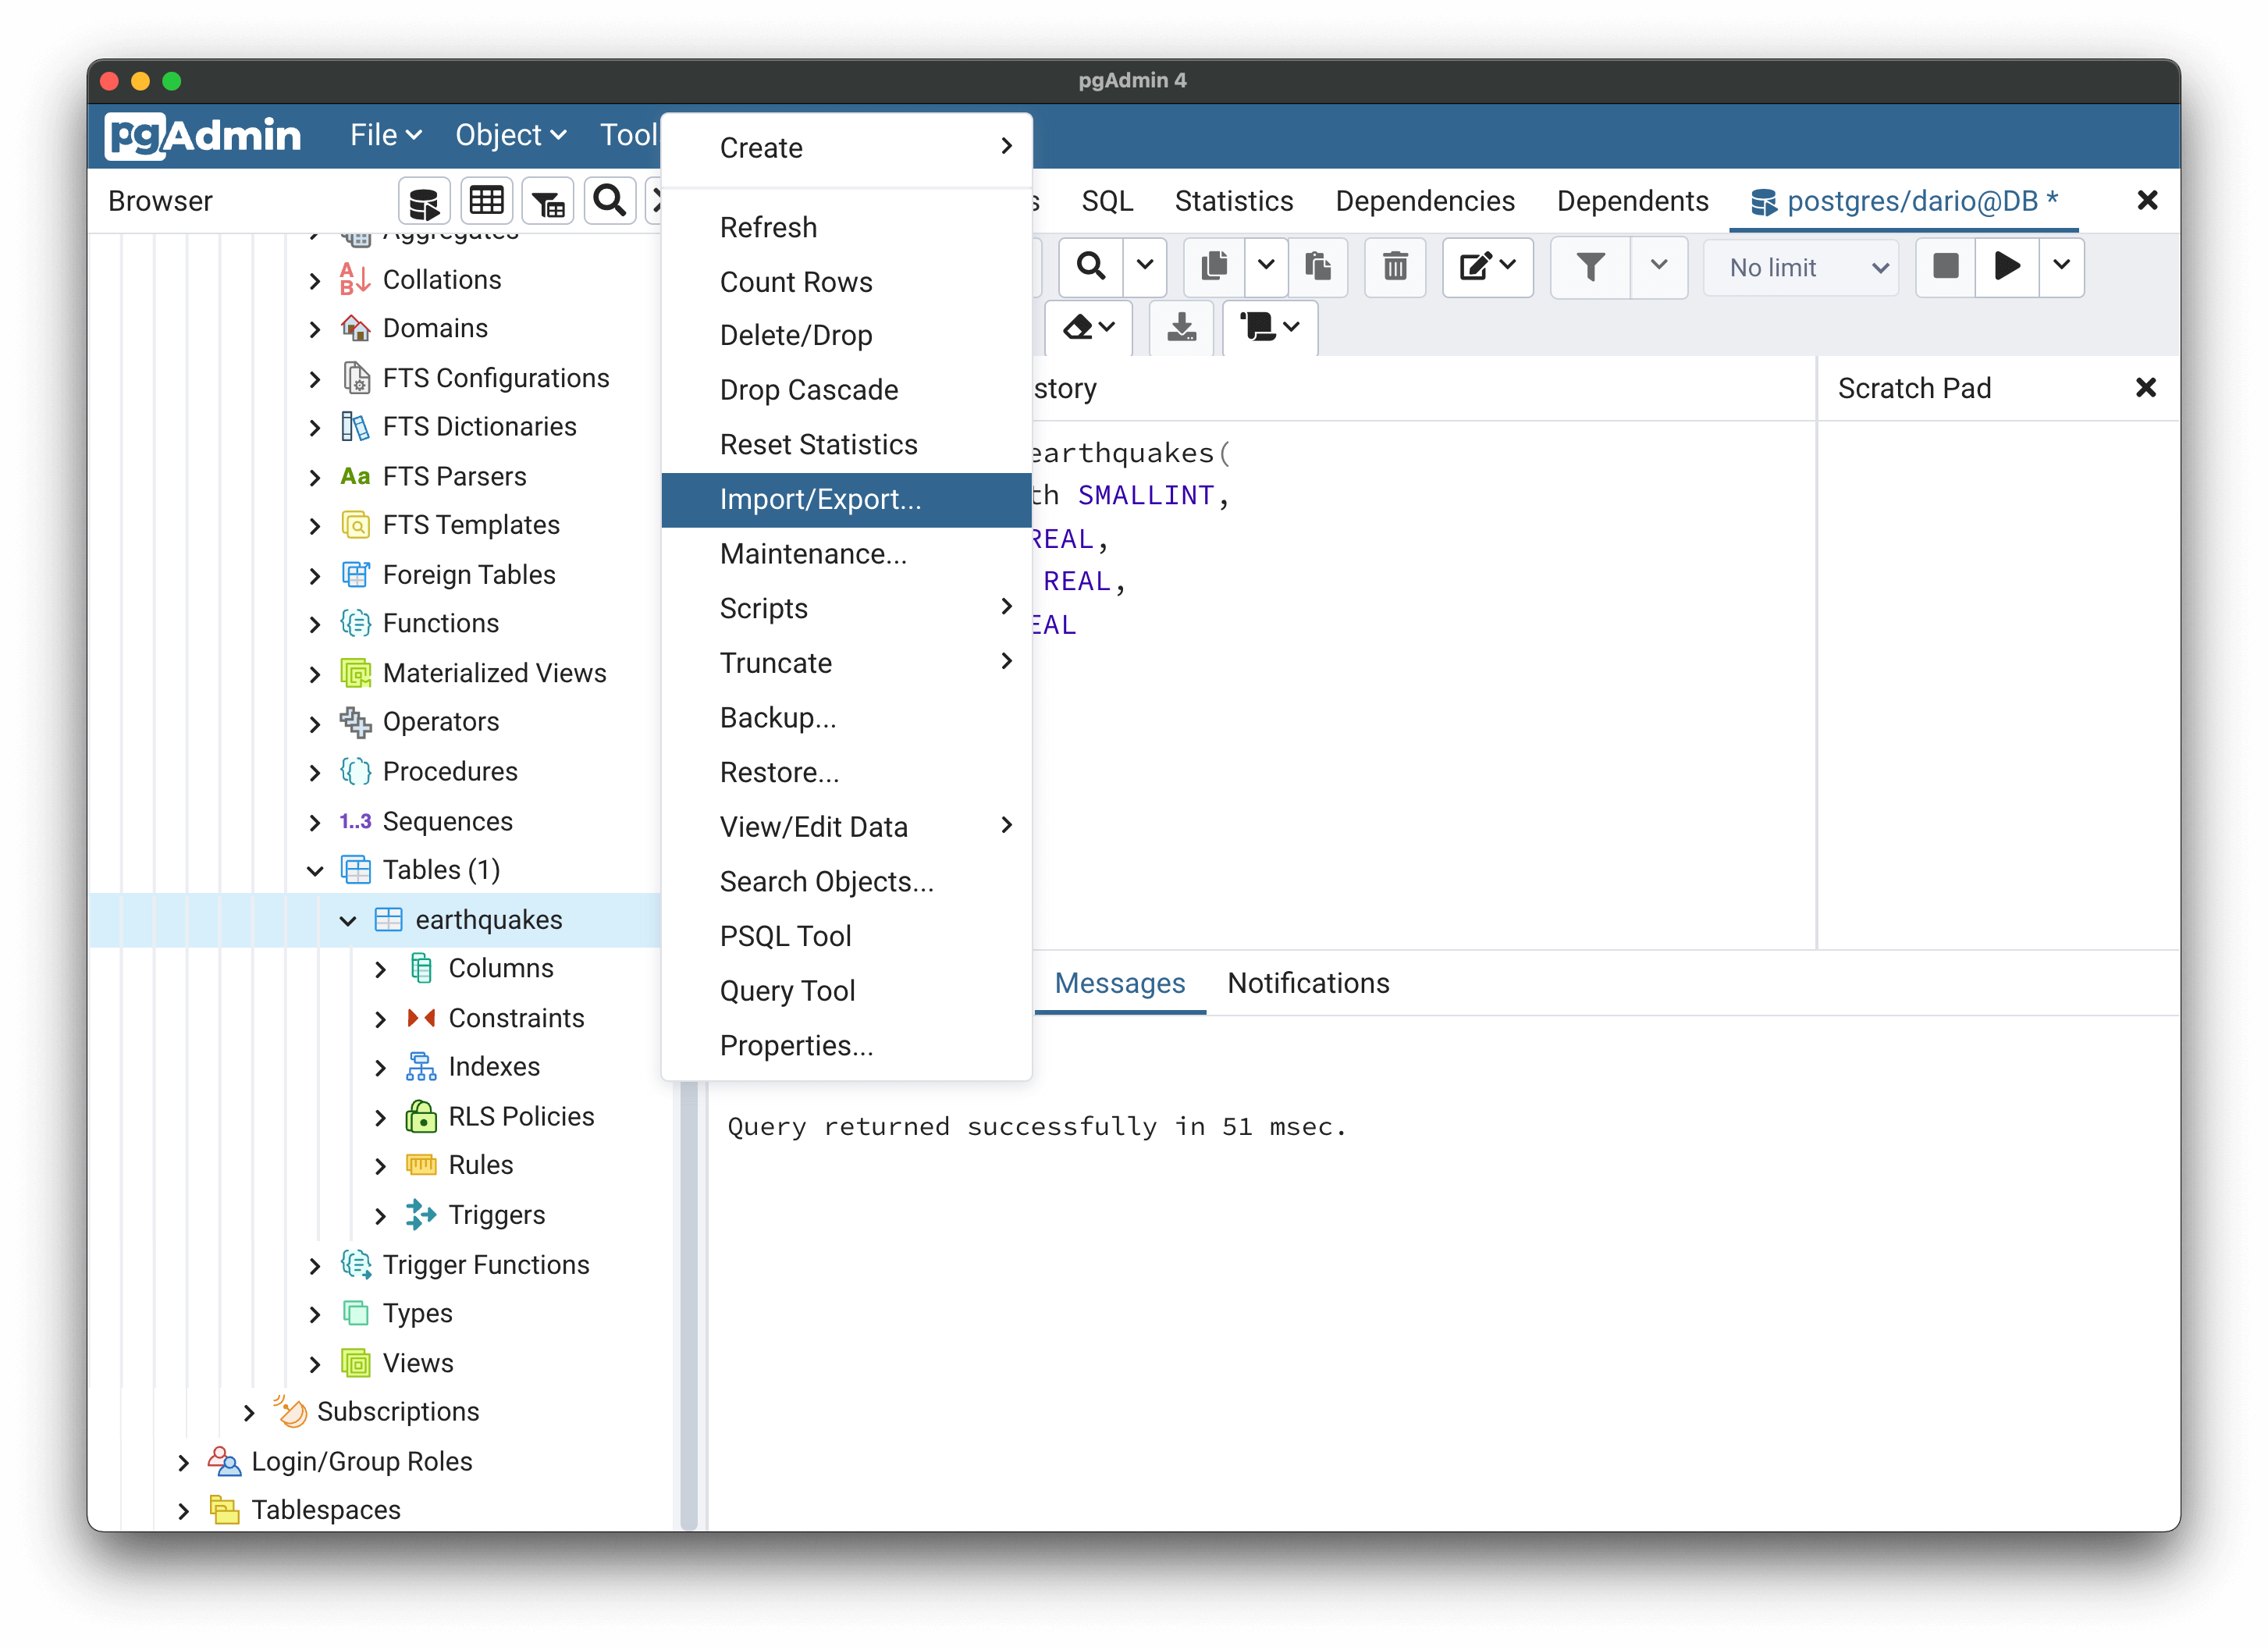
Image 2 – Importing CSV file into Postgres database (1)
A new modal window will open. There are a couple of things to do here:
- Toggle the Import switch
- Specify the path to the CSV file
- Make sure that the Header is toggled
- Specify comma as a delimiter
Here’s what the window should look like:
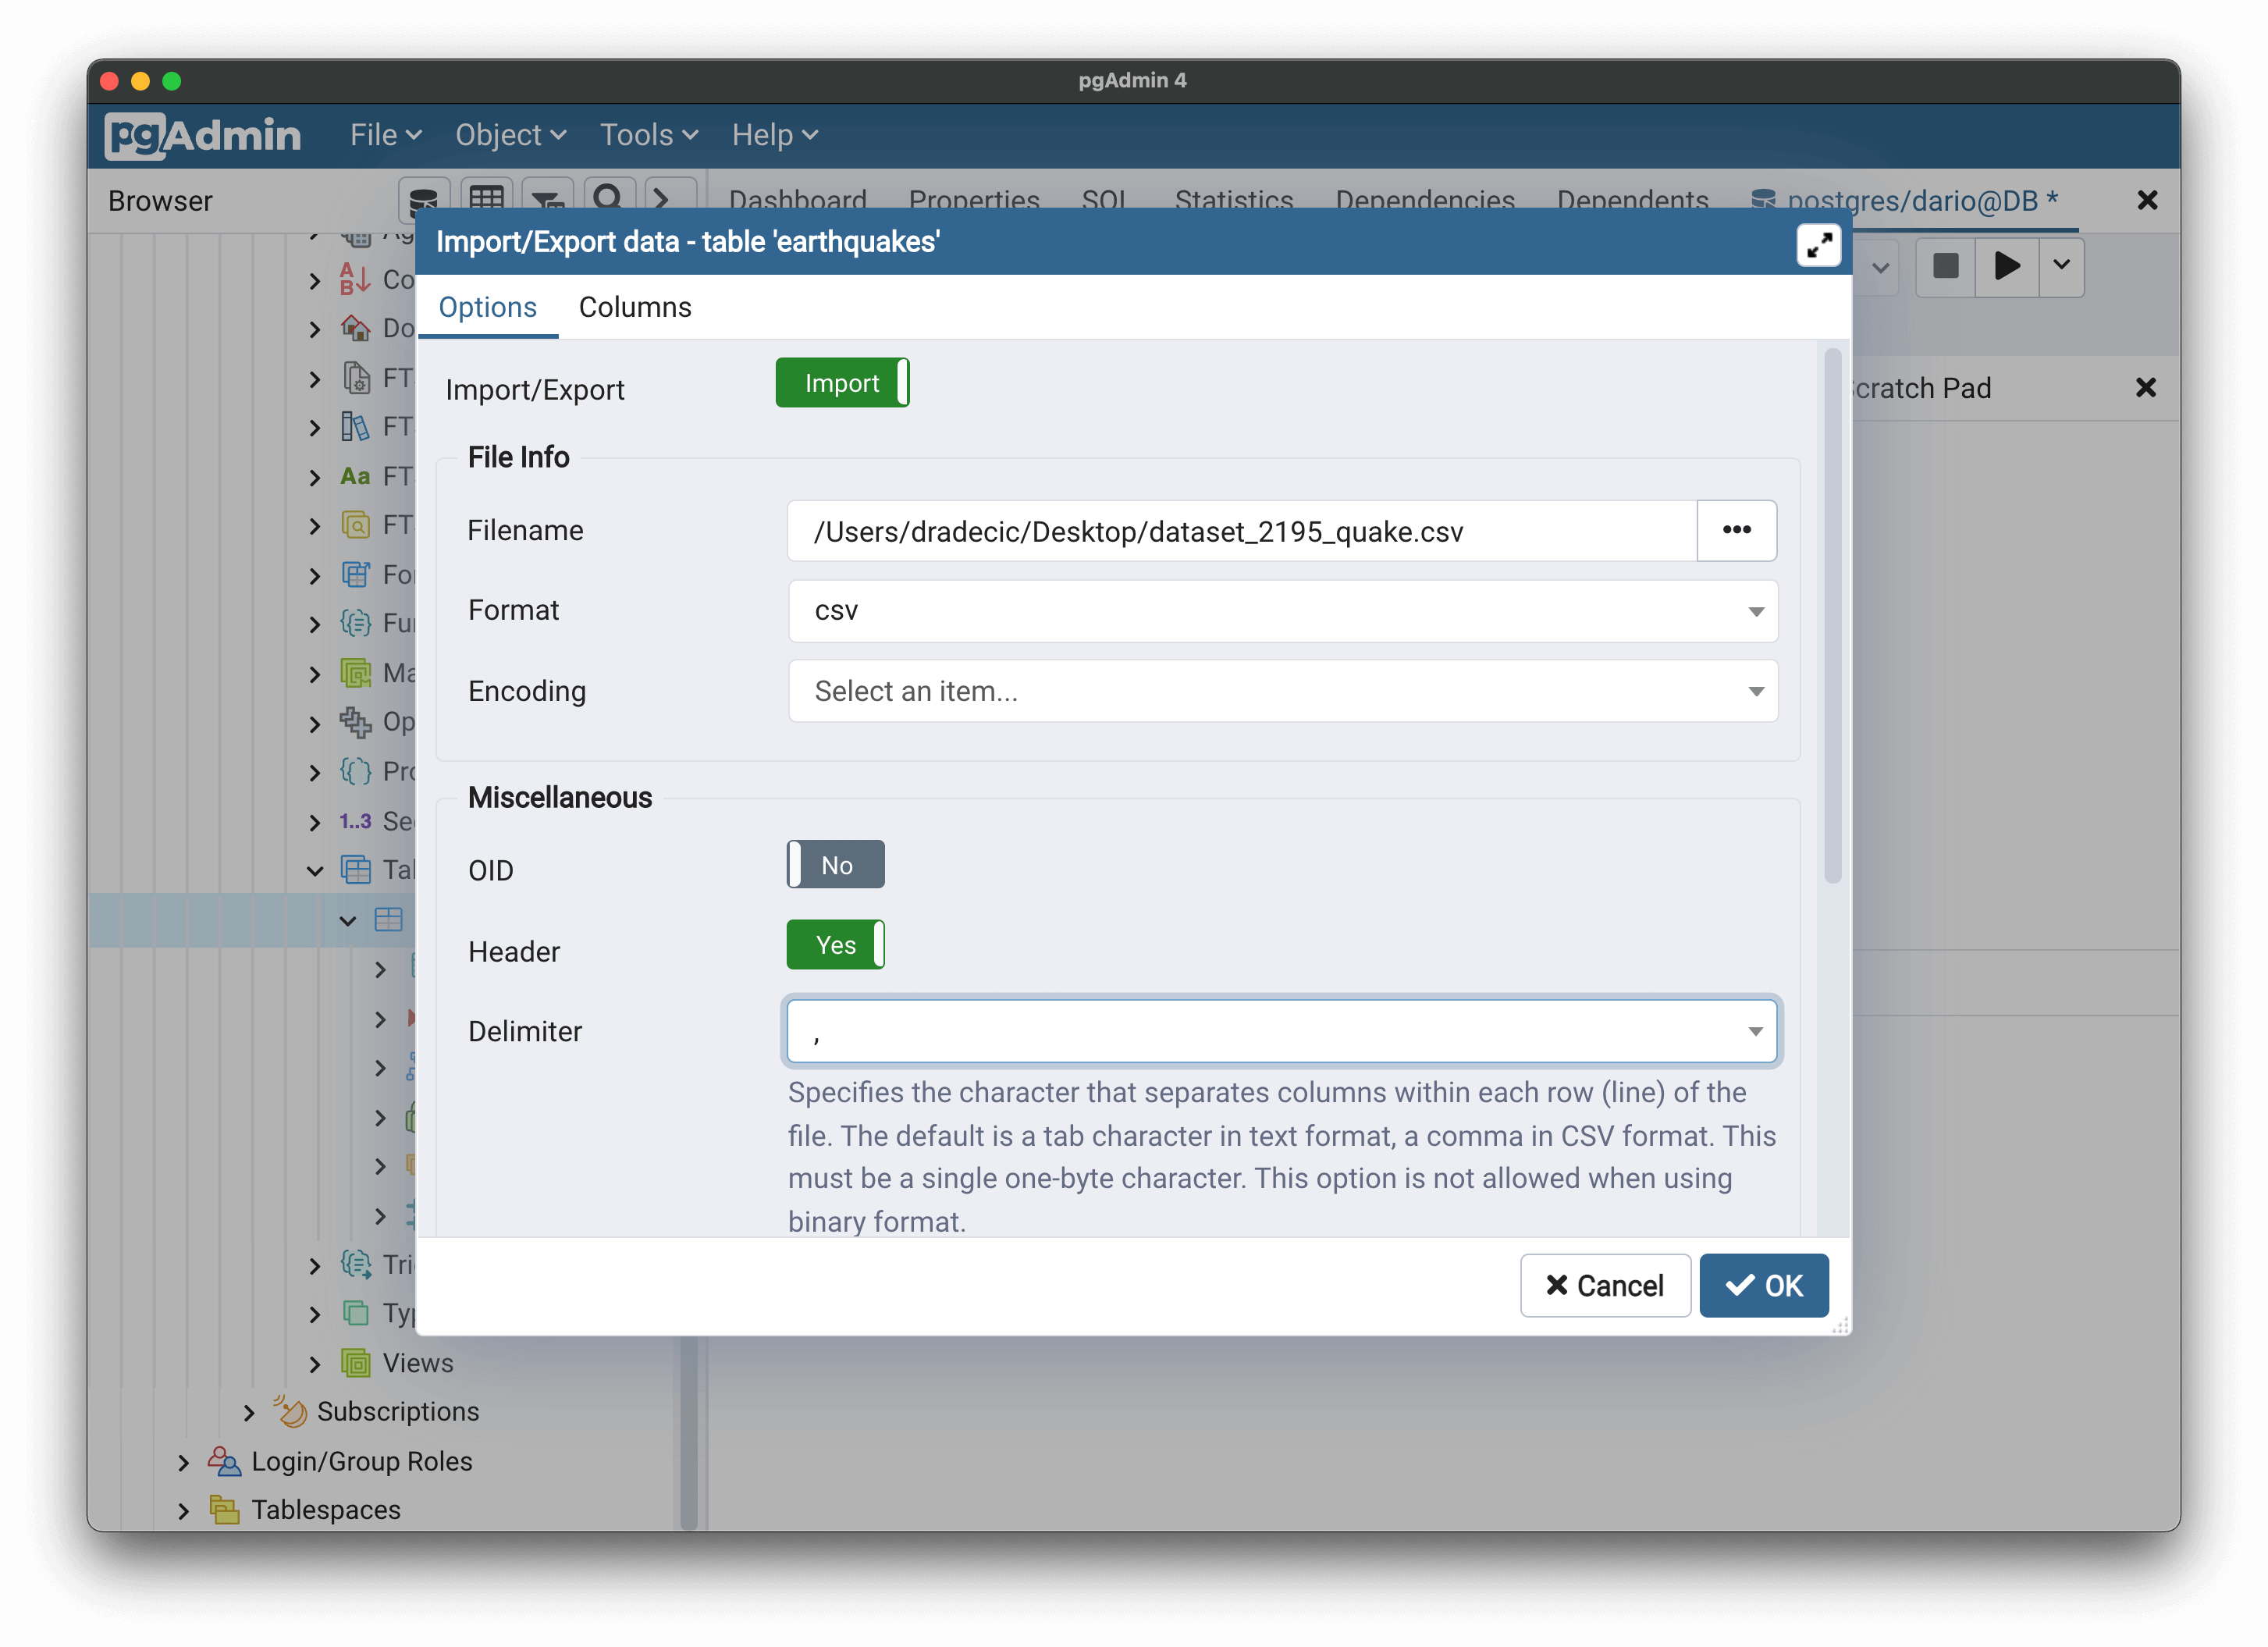
Image 3 – Importing CSV file into Postgres database (2)
We’re not quite done yet. Switch to the Columns tab to ensure all four are adequately listed:
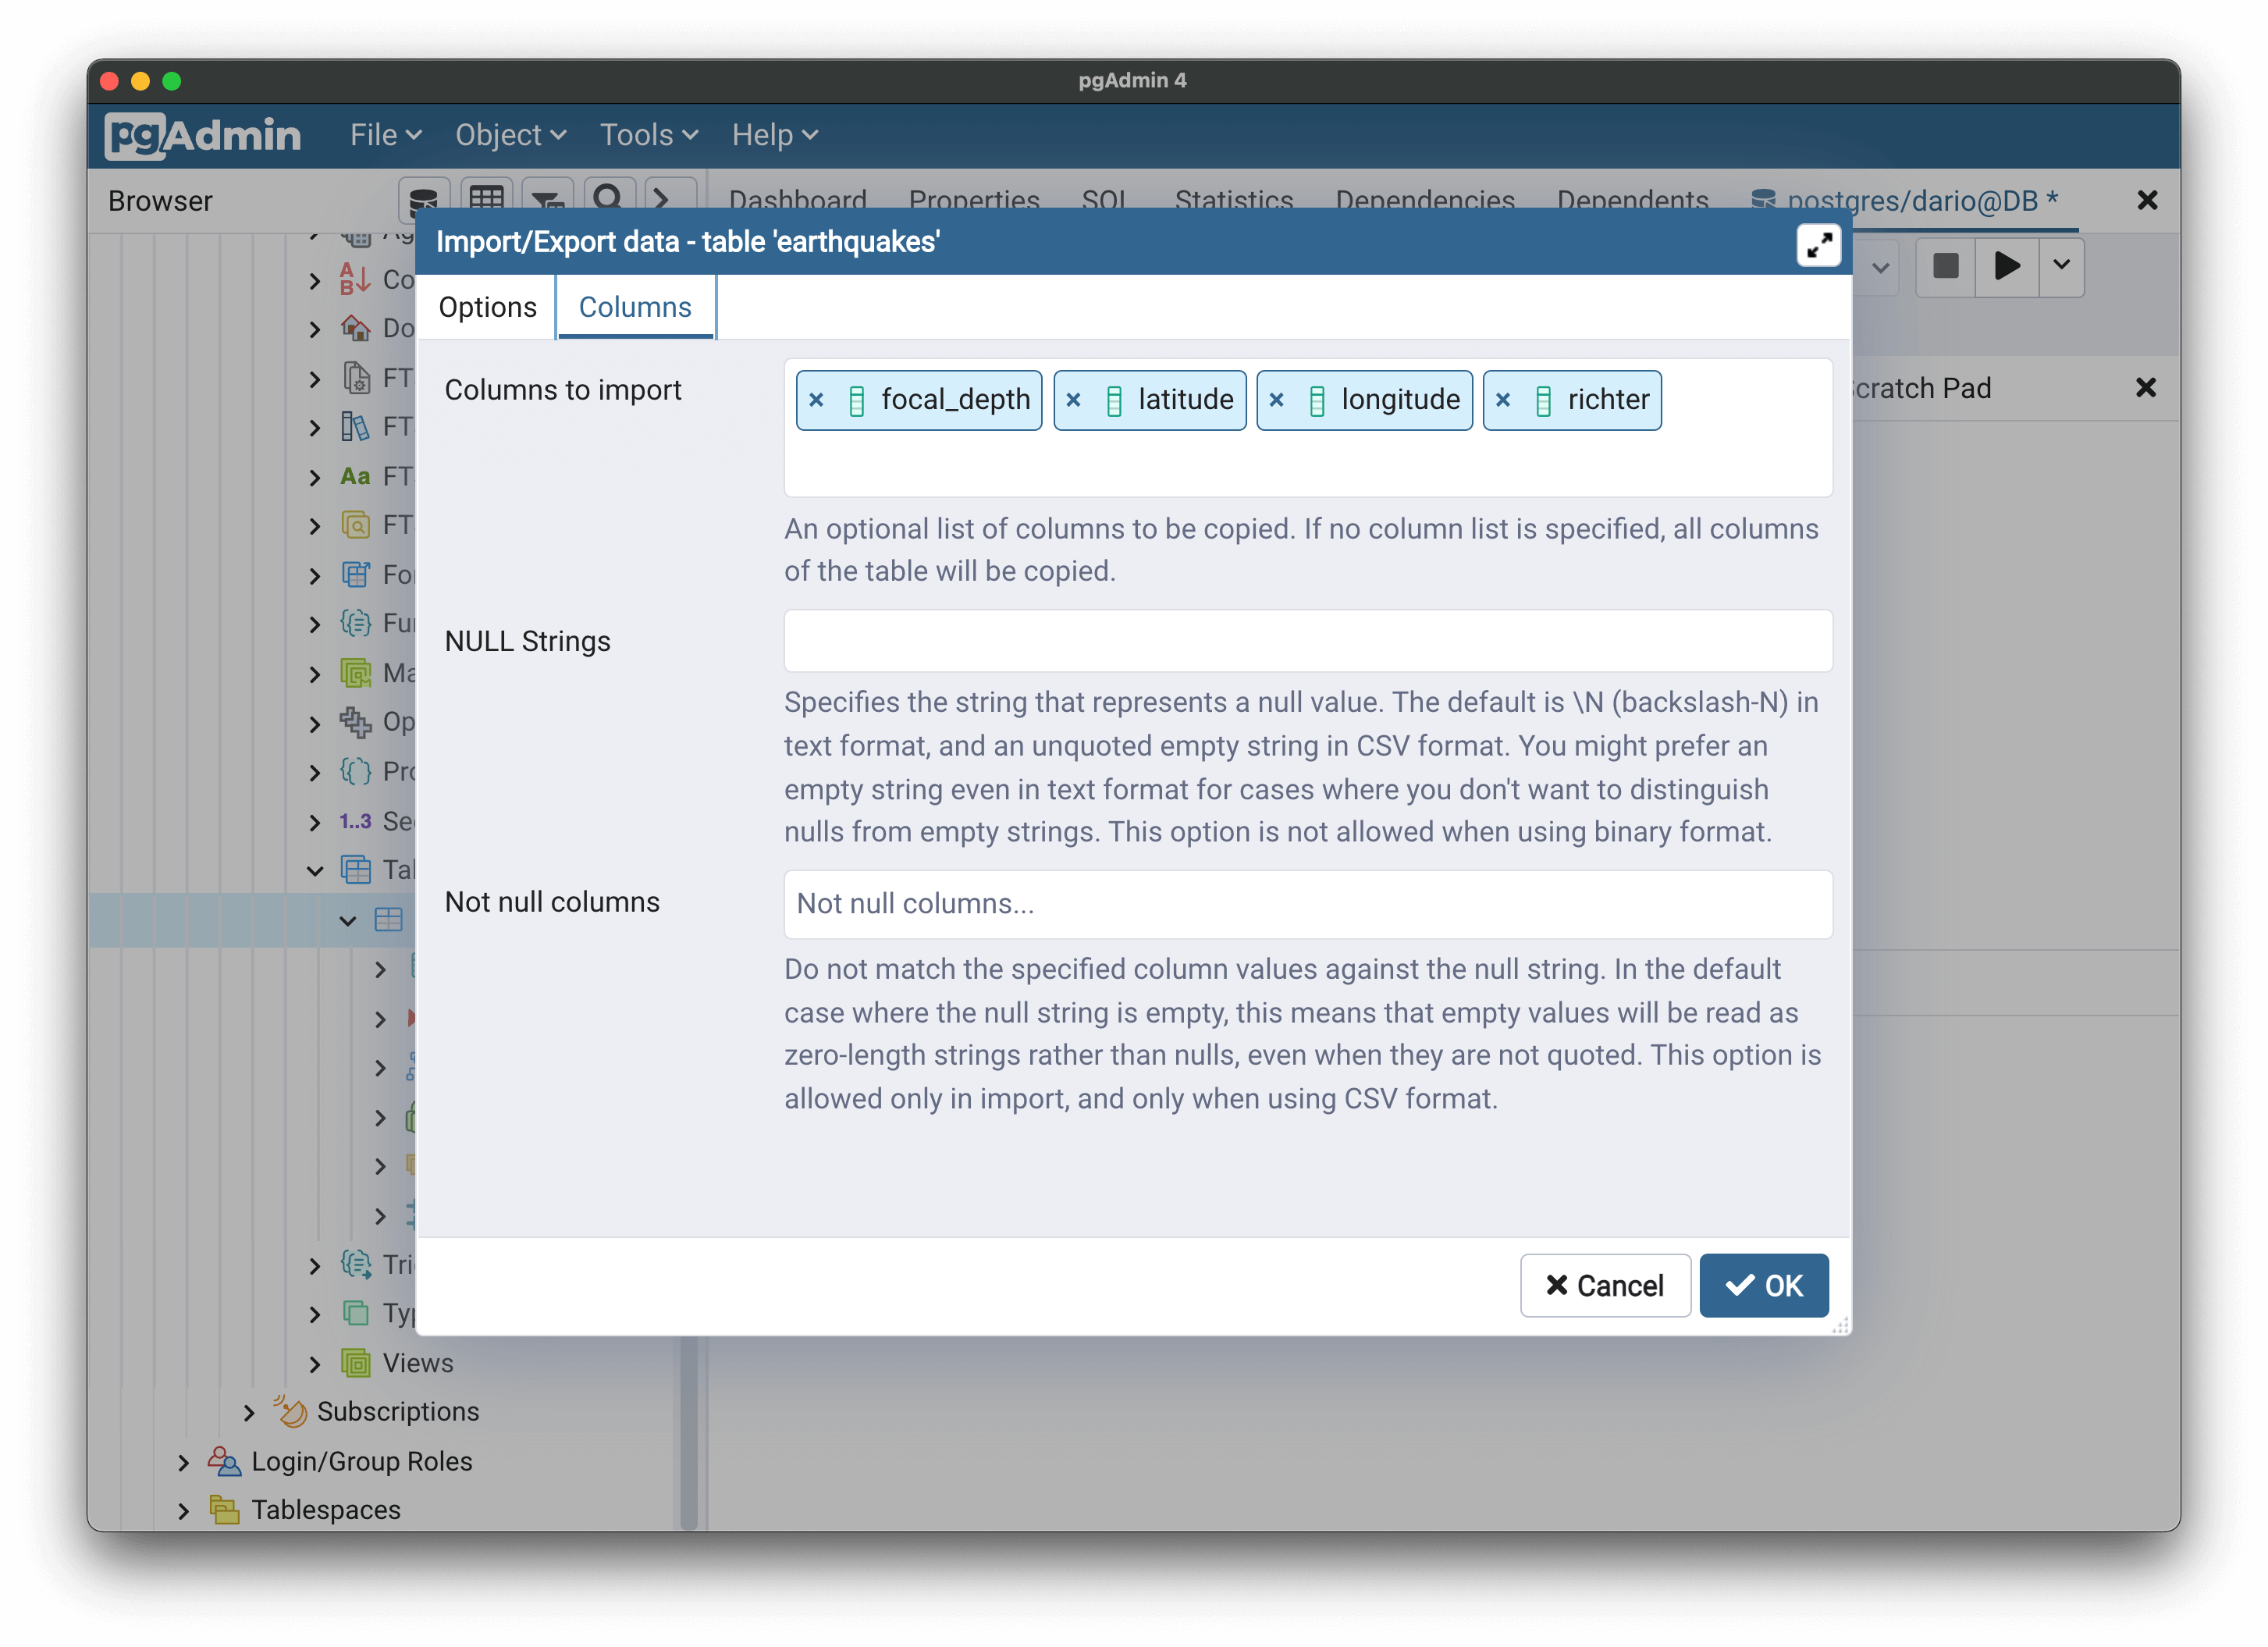
Image 4 – Importing CSV file into Postgres database (3)
If everything looks as in the image above, you can click on the OK button. You should see a message telling you the dataset was successfully imported after a couple of seconds:
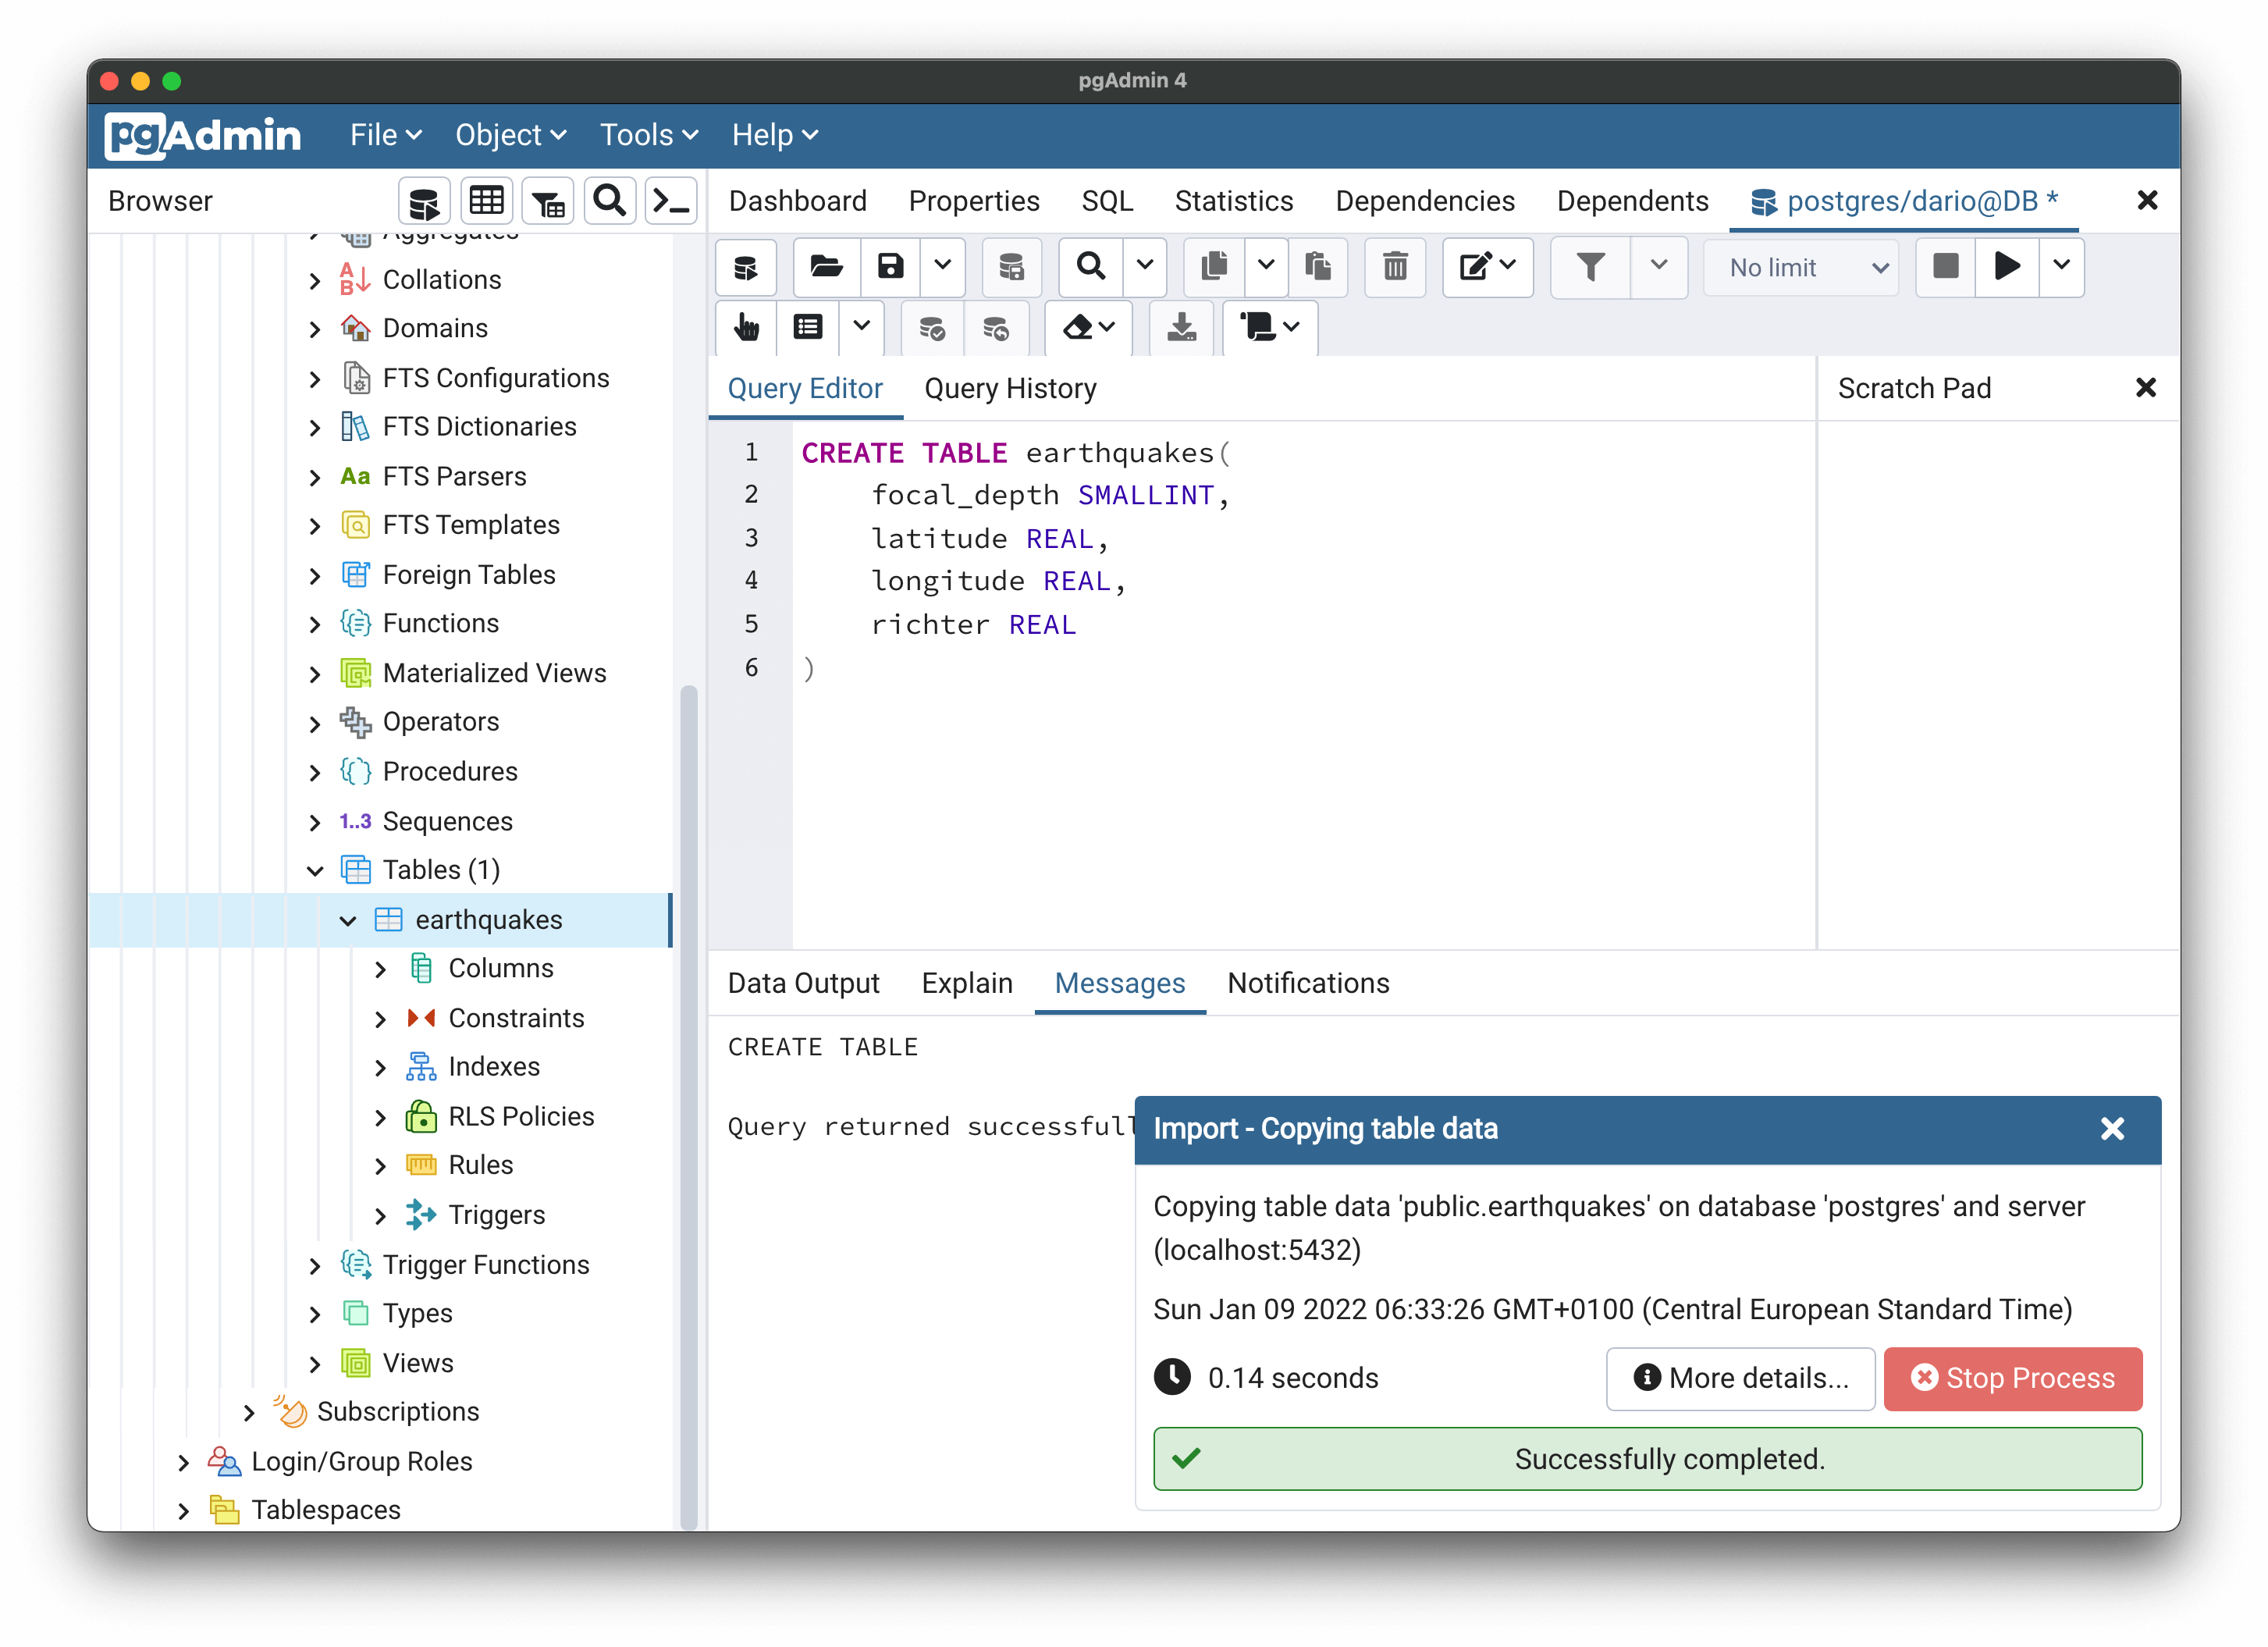
Image 5 – Importing CSV file into Postgres database (4)
Execute the following SQL command from the query editor to double-check:
You should see the table populated with data:
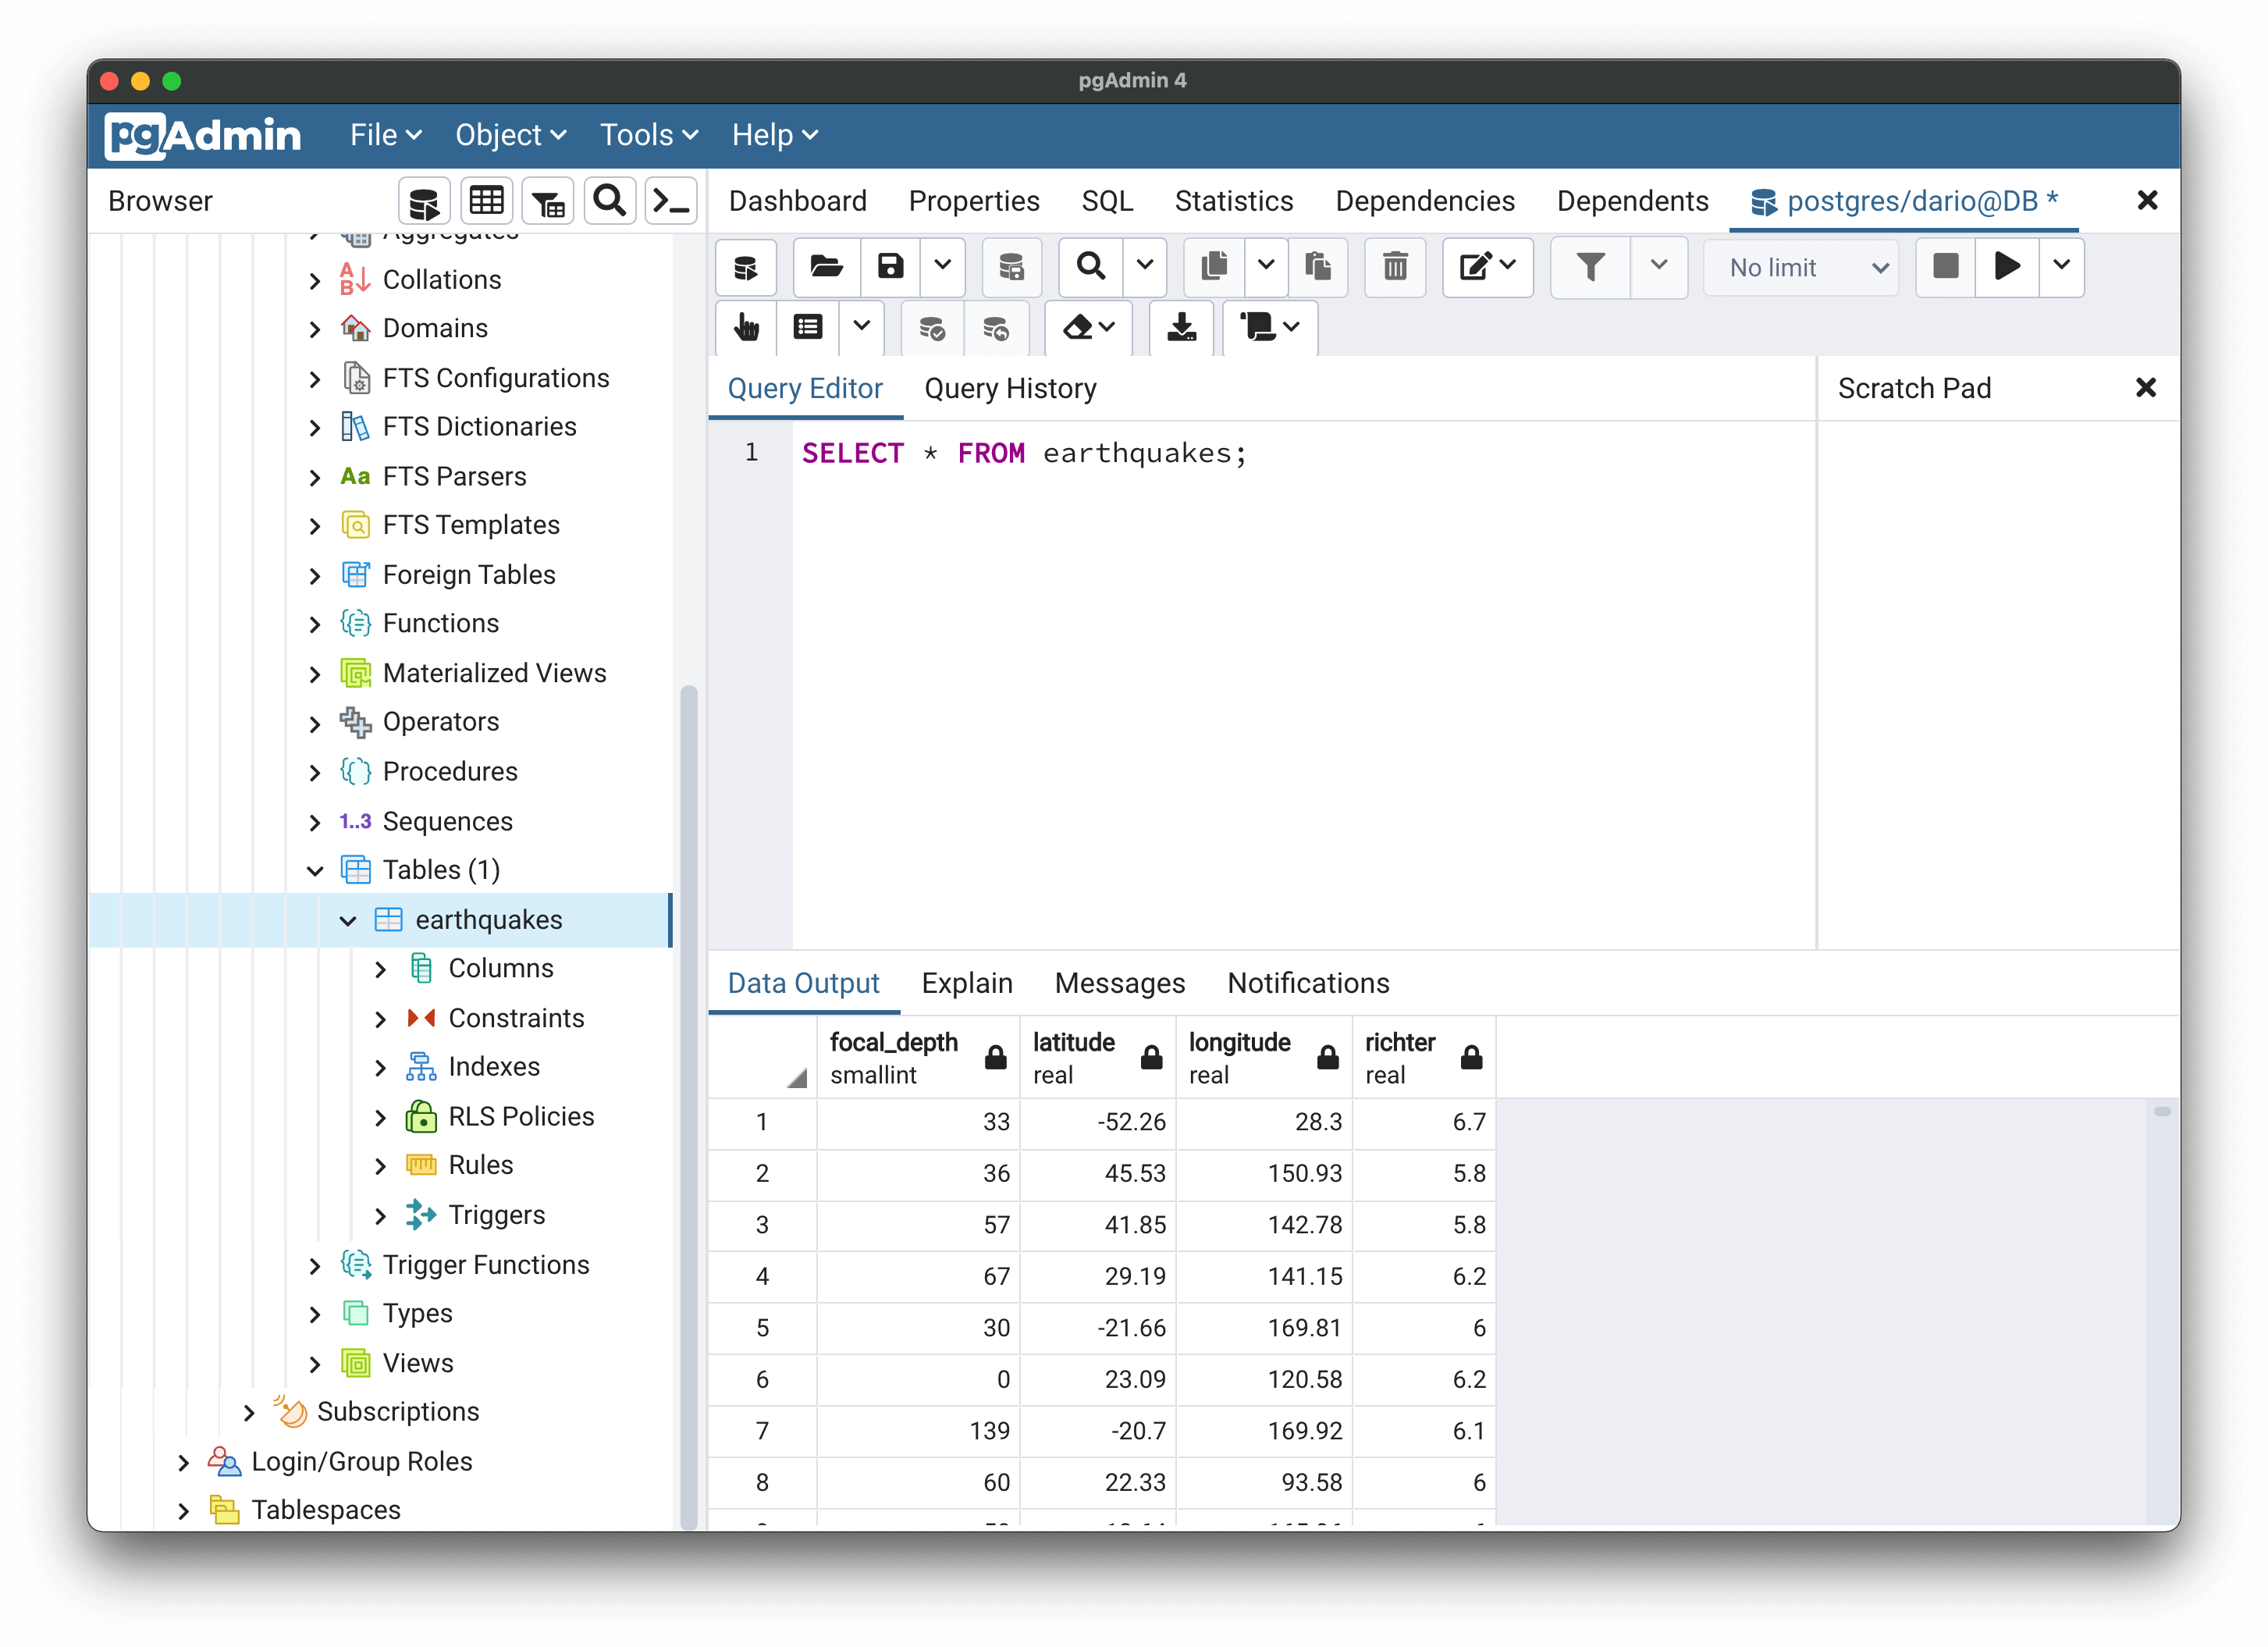
Image 6 – Checking if import to Postgres database was successful
To conclude – we now have the dataset loaded into the Postgres database. But how can we connect to it from R and R Shiny? That’s what we’ll answer next.
Are you a bit rusty with SQL? Use the following articles as a refresher:
- Introduction to SQL: 5 Key Concepts Every Data Professional Must Know
- Intermediate SQL for Data Science – Analytical Functions Deep Dive
Connect R to Postgres Database
You’ll need two packages to get started, so install them before doing anything else:
You also need to know a couple of things to connect R to the Postgres database:
- Database name:
postgresby default, but check by listing the databases in pgAdmin. - Host: It’s
localhost, since we’re using the locally-installed database. - Port:
5432in our case – check yours by right-clicking the database server and checking the value under Properties – Connection – Port. - Username and password – Credentials for your user.
Once you know these, connecting to the Postgres database is as simple as a function call:
You won’t see any output, so how can you know the connection was established? Simple, just list the available tables:
Image 7 – Listing available tables in the Postgres database through R
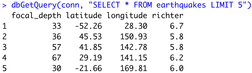
The earthquakes table is the only one visible, so we’re on the right track. If you want to fetch data from it, use the dbGetQuery function as shown below:
Image 8 – Fetching data from the Postgres database through R
And there you have it – concrete proof we have successfully established a connection to the Postgres database. Let’s see how to integrate it with R Shiny next.
Connect R Shiny to Postgres and Create a Dashboard
We’ll create a simple R Shiny dashboard that renders a map of earthquakes of the specified magnitude. The dashboard will have a slider that controls the minimum magnitude required for the earthquake to be displayed on the map.
When the slider value changes, R Shiny connects to the Postgres database and fetches earthquakes with the currently specified magnitude and above.
The dashboard uses the Leaflet package for rendering the map and shows a custom icon as a marker.
Image 9 – R Shiny dashboard based on a Postgres database
You have to admit – developing PoC dashboards like the one above requires almost no effort. R Shiny does all the heavy lifting for you, and probably the most challenging part is maintaining the database connection.
You could extract the entire table outside the server function, and that would make the dashboard faster. We’ve decided to establish a new connection every time the input changes to show you how to open and close database connections, and how to use the glue package for better string interpolation.
New to interactive maps? We have you covered:
- Build Interactive Google Maps With R Shiny – A Complete Guide
- Leaflet vs. Tmap – Which Should You Use to Build Interactive Maps with R and R Shiny
Conclusion
Managing Postgres database connections through R is simpler than it sounds at first. You only need to know the connection parameters and remember to close the connection once you’re done working with the database. R handles everything else.
You’ve created a functional but pretty-basic dashboard today, so there’s definitely room for improvement. Here are a couple of challenges you can do next:
- Load in the entire
earthquakestable outside theserverfunction and usedplyrto filter the results. Is the dashboard significantly faster? - Render a table showing earthquake data alongside the map.
Feel free to share results with us on Twitter – @appsilon. We’d love to see what you came up with.
If you’re looking for a faster way to showcase your map online, check out our Shiny Dashboard Templates. They’re free to use and a great launching point for your project.
Contact Us
Project Manager

Get Updates
Subscribe to Shiny Weekly Newsletter
Join 4000+ Shiny enthusiasts to see the latest Shiny news from the R community.