Rapid Multi-Language Support for Shiny Apps
Have you ever created a multilingual Shiny application? Chances are the answer is yes. Especially if you are a big fan of Appsilon‘s blog and have read our first article on the topic. If that’s not the case – fear not – we’ll cover everything you need to know today about how to rapidly add multi-language support to Shiny apps. If you already know a lot about shiny.i18n, feel free to jump to any section:
To learn more about Appsilon’s open-source packages, see our new Open Source Landing Page:
Introduction to shiny.i18n
At Appsilon we routinely build Shiny applications for Global 2000 companies, and we’ve come across the internationalization problem multiple times. It made sense to develop an open-source package that handles multilanguage options with ease. Version 0.1.0 has been out for quite some time now, and we are proud to announce a new, upgraded version – 0.2.0.
NOTE: shiny.i18n usage is not limited to Shiny apps. You can use it as a standalone R package for generating multilingual reports or visualizations without Shiny. We decided on the name “shiny.i18n” because Shiny is the most common and obvious use-case scenario for the package.
The latest version of the package is available on CRAN, so installation is extremely easy:
install.packages('shiny.i18n')The package utilizes specific translation file data formats – currently in JSON and CSV.
JSON Format
Here’s an example of a JSON translation file for English, Polish, and Croatian languages:
{
    "languages": ["en", "pl", "hr"],
    "translation": [
        {
            "en": "MtCars Dataset Explorer",
            "pl": "Eksplorator danych: MtCars",
            "hr": "Istraživanje MtCars Dataseta"
        },
        {
            "en": "Change language",
            "pl": "Wybierz język",
            "hr": "Promijeni jezik"
        },
        {
            "en": "Select",
            "pl": "Wybierz",
            "hr": "Odaberi"
        },
        {
            "en": "This is description of the plot.",
            "pl": "To jest opis obrazka.",
            "hr": "Ovo je opis grafikona."
        },
        {
            "en": "Scatter plot",
            "pl": "Wykres punktowy",
            "hr": "Dijagram raspršenja"
        },
        {
            "en": "X-Axis",
            "pl": "Oś X",
            "hr": "X os"
        },
        {
            "en": "Y-Axis",
            "pl": "Oś Y",
            "hr": "Y os"
        }
    ]
}
As you can see, only two fields are required:
- languages – list of language codes
- translation – JSON objects containing translation to all languages
CSV Format
The main idea behind this format is to support distributed translation tasks among many translators. It’s not convenient for them to work together on a single file, but instead, they can store individual files in the same folder. Here’s the example folder structure:
translations/
translation_pl.csv
translation_hr.csv
Every CSV file in the translations folder should look like this:
en, hr
Hello Shiny!, Pozdrav, Shiny!
Histogram of x,	Histogram od x
This is a description of the plot., Ovo je opis grafikona.
Frequency, Frekvencija
Number of bins:, Broj binova:
Change language, Promijeni jezik
Awesome! Let’s now take a look at the version 0.2.0 changelog, and then we’ll jump to a dashboard example.
What New in Version 0.2.0
The complete changelog list for every version is located at GitHub.com, but here’s what new in the most recent version:
Added:
- Auxiliary preprocessing functions – they create example translation CSV or JSON files
- RStudio add-in that searches for all i18n tags
- Browser-side translations to dramatically improve performance
- automatic translations via API (currently only google cloud supported)
- 2 vignettes with tutorials
- examples with live language translation on the UI side and with automatic translation via API
pkgdowndocumentation
Changed:
translatemethod now automatically detects whether the object is in UI or server and applies reactive or js translation accordingly
Dashboard Example
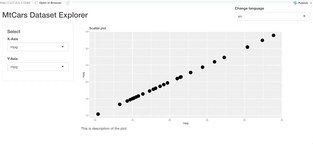
To demonstrate how shiny.i18n works in practice, we’ll develop a simple dashboard application based on the mtcars dataset. This dashboard can be used to make scatter plots of the two columns specified by the user.
To start, we’ll import a couple of required libraries and initialize the translator. We’ve stored the translations file in translations/translation.json, so keep that in mind if yours is stored elsewhere:
library(shiny)
library(shiny.i18n)
library(ggplot2)

i18n <- Translator$new(translation_json_path='translations/translation.json')
i18n$set_translation_language('en')
Next, we can define the UI. There are a couple of things we want to have:
- Dropdown menu for language – somewhere in the top right is fine
- Title panel – to inform the user what our app is all about
- Sidebar – contains two dropdown menu for X and Y axes, respectively
- Main panel – contains a chart and the chart description
Here’s the code for the UI:
ui <- fluidPage(
  shiny.i18n::usei18n(i18n),
  tags$div(
    style='float: right;',
    selectInput(
      inputId='selected_language',
      label=i18n$t('Change language'),
      choices = i18n$get_languages(),
      selected = i18n$get_key_translation()
    )
  ),
  titlePanel(i18n$t('MtCars Dataset Explorer'), windowTitle=NULL),
  sidebarLayout(
    sidebarPanel(
      width=3,
      tags$h4(i18n$t('Select')),
      varSelectInput(
        inputId='x_select',
        label=i18n$t('X-Axis'),
        data=mtcars
      ),
      varSelectInput(
        inputId='y_select',
        label=i18n$t('Y-Axis'),
        data=mtcars
      )
    ),
    mainPanel(
      plotOutput(outputId='scatter'),
      tags$p(i18n$t('This is description of the plot.'))
    )
  )
)
The last step remaining is to build the server. The observeEvent function will help us to detect language change and to make translations accordingly. As a final step, we can use the renderPlot reactive function to display our scatter plot:
server <- function(input, output, session) {
  observeEvent(input$selected_language, {
    update_lang(session, input$selected_language)
  })

  output$scatter <- renderPlot({
    col1 <- sym(input$x_select)
    col2 <- sym(input$y_select)

    ggplot(mtcars, aes(x= !! col1, y= !! col2)) +
      geom_point(size=6) +
      ggtitle(i18n$t('Scatter plot'))
  })
}

shinyApp(ui=ui, server=server)
And that’s all we have to do. Our final application is simple but perfectly captures how easy it is to implement multilanguage functionality.
Conclusion
In this relatively short hands-on guide, we’ve demonstrated what shiny.i18n is and how it can be used to develop multilingual dashboards. Version 0.2 brought some exciting new features. The most important feature to us is the ability to not have to render everything in the server function, which was the case with the earlier version. The other new feature is automatic translation, powered by Google Cloud. It requires a bit of setup, and you can learn more about it here.
Curious about automatic translation? Here’s how to implement it with Shiny and i18n.
Learn More
- shiny.worker: Speed Up Shiny Apps by Offloading Heavy Calculations
- Video: How to Scale Shiny Dashboards
- Appsilon is hiring talented R Shiny Developers. Check out our open positions here.


