Share
Share Tweet
Tweet Share
Share


shiny.benchmark – How to Measure Performance Improvements in R Shiny Apps

04 January 2023
The shiny.benchmark package by Appsilon allows you to compare the performance of different versions of R Shiny applications. You can write instructions that will be executed and evaluated on different versions of your app and easily measure the performance differences.
In today’s article, you’ll learn how to install and use the shiny.benchmark package by exploring and tweaking an example Shiny application. So without much ado, let’s dive straight in.
Looking to implement infinite scrolling in R Shiny? Our Infinite Scroll guide has you covered.
Table of contents:
- How to install shiny.benchmark
- Benchmarks in action: How to use shiny.benchmark
- Summing up the shiny.benchmark R package
How to install shiny.benchmark
Before installing the package, we need to talk prerequisites. The shiny.benchmark package can use two different engines to evaluate app performance: shinytest2 and Cypress.
It doesn’t matter which one you opt for, but keep in mind that Cypress requires Node.js and yarn, so make sure to have them installed. If you’re on Linux, Cypress might also require some additional dependencies, so check the documentation link if you’re running into errors.
FYI – Rhino now supports both Cypress and shinytest2.
Assuming you have all the prerequisites out of the way, it’s time to install shiny.benchmark. Run the following command to install the latest version from CRAN:
install.packages("shiny.benchmark")
And that’s it! Next, let’s see how to use Shiny Benchmark.
Benchmarks in action: How to use shiny.benchmark
The simplest way to see how shiny.benchmark works is to use the sample app it ships with. The load_example() function will download the sample R Shiny application to the path you provide:
library(shiny.benchmark)
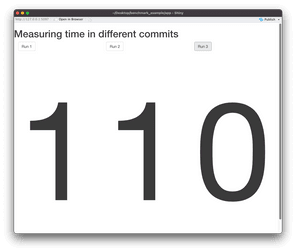
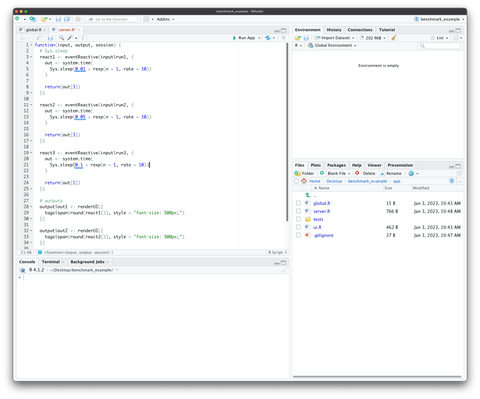
load_example(path = "path/to/your/folder")Here’s what the app looks like when loaded (and after each button gets pressed):
Image 1 – Sample R Shiny benchmark app
The heart of this application lies in the server.R file. It instructs the app to sleep for some time after each button gets clicked. The default values are 1, 0.5, and 0.1 seconds for the first, second, and third buttons, respectively.
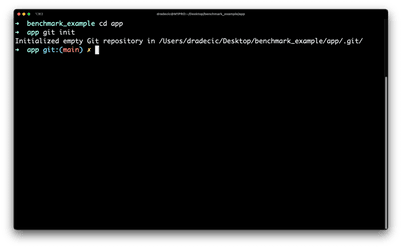
We’ll tweak this file later, but first, need to make different versions of the app. Navigate to the app folder and initialize a new Git repository:
cd app
git init
Image 2 – Initializing a new Git repo
While here, let’s create a .gitignore file which will contain all files we don’t want to track:
echo .Rproj.user >> .gitignore
echo *.Rproj >> .gitignore
echo .Rprofile >> .gitignore
echo renv >> .gitignore
echo .Rprofile >> .gitignore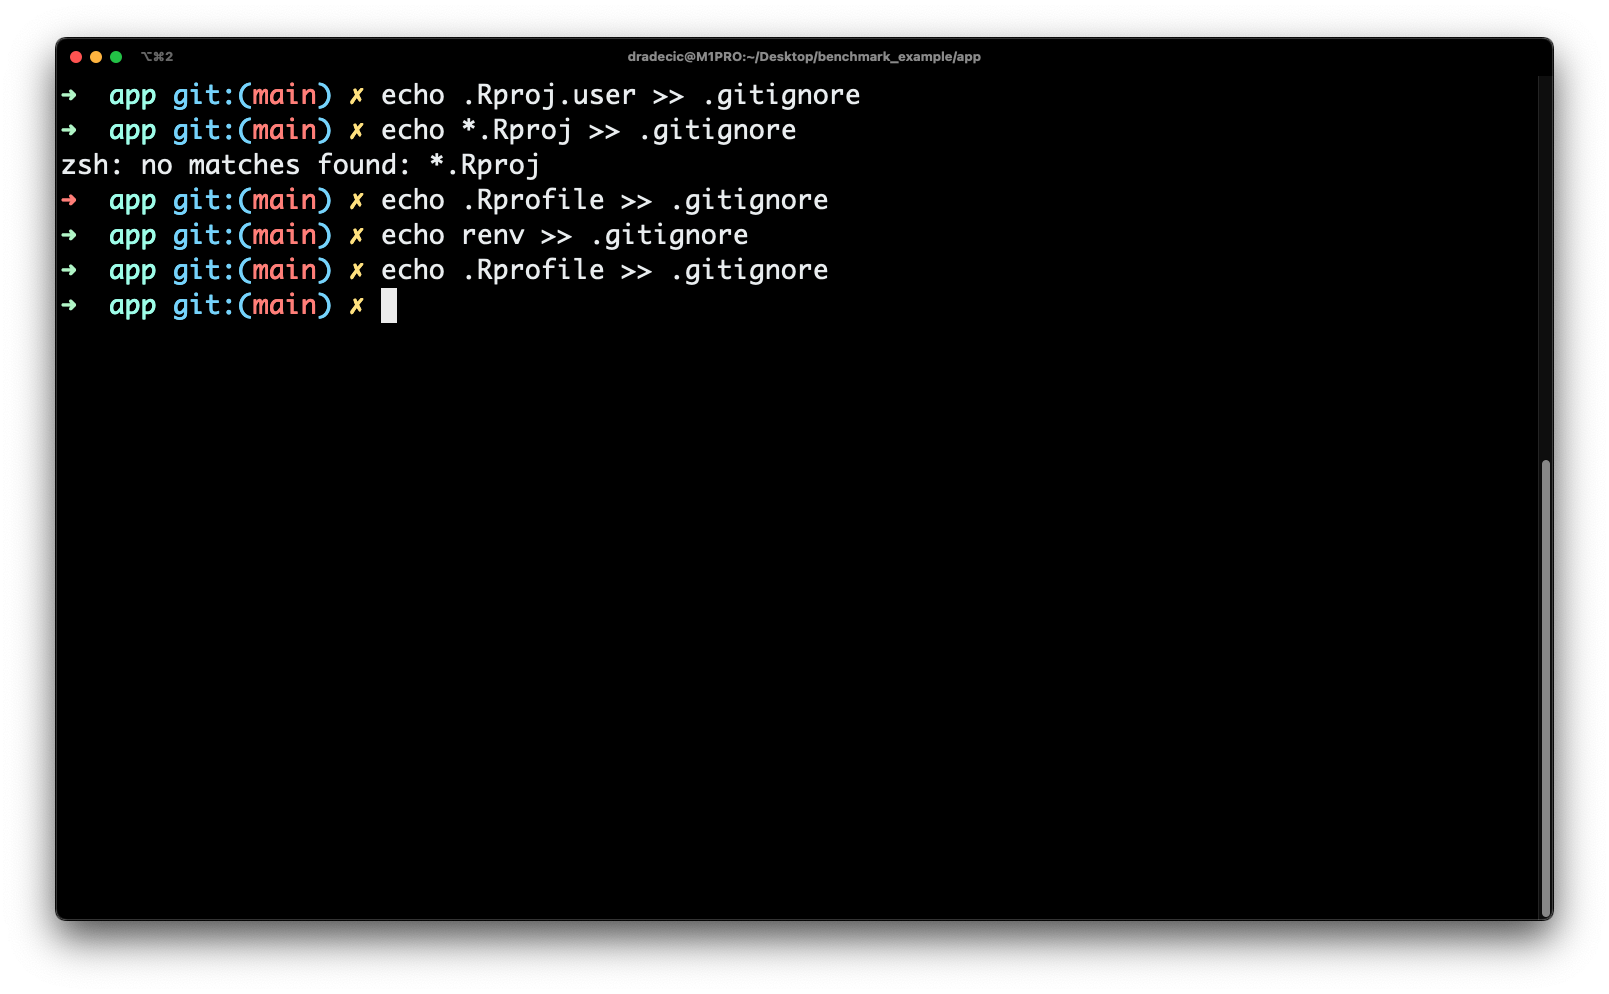
Image 3 – Creating a .gitignore file
App Version #1 – The Default App
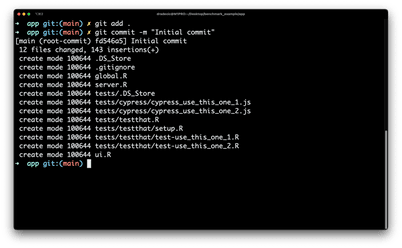
And now, let’s finally create a couple of versions of our app. The first one (main branch) will contain the app in its stock format – no modifications made to server.R file. Add all files to the staging area and commit with the following command:
git add .
git commit -m "Initial commit"
Image 4 – Commit to the main branch
App Version #2 – Longer Sleep Times
The second version of the app will be identical UI-wise but will include longer sleep times. You only need to modify the server.R file and change the values in three calls to Sys.sleep().
Here’s an example of a modified server.R file:
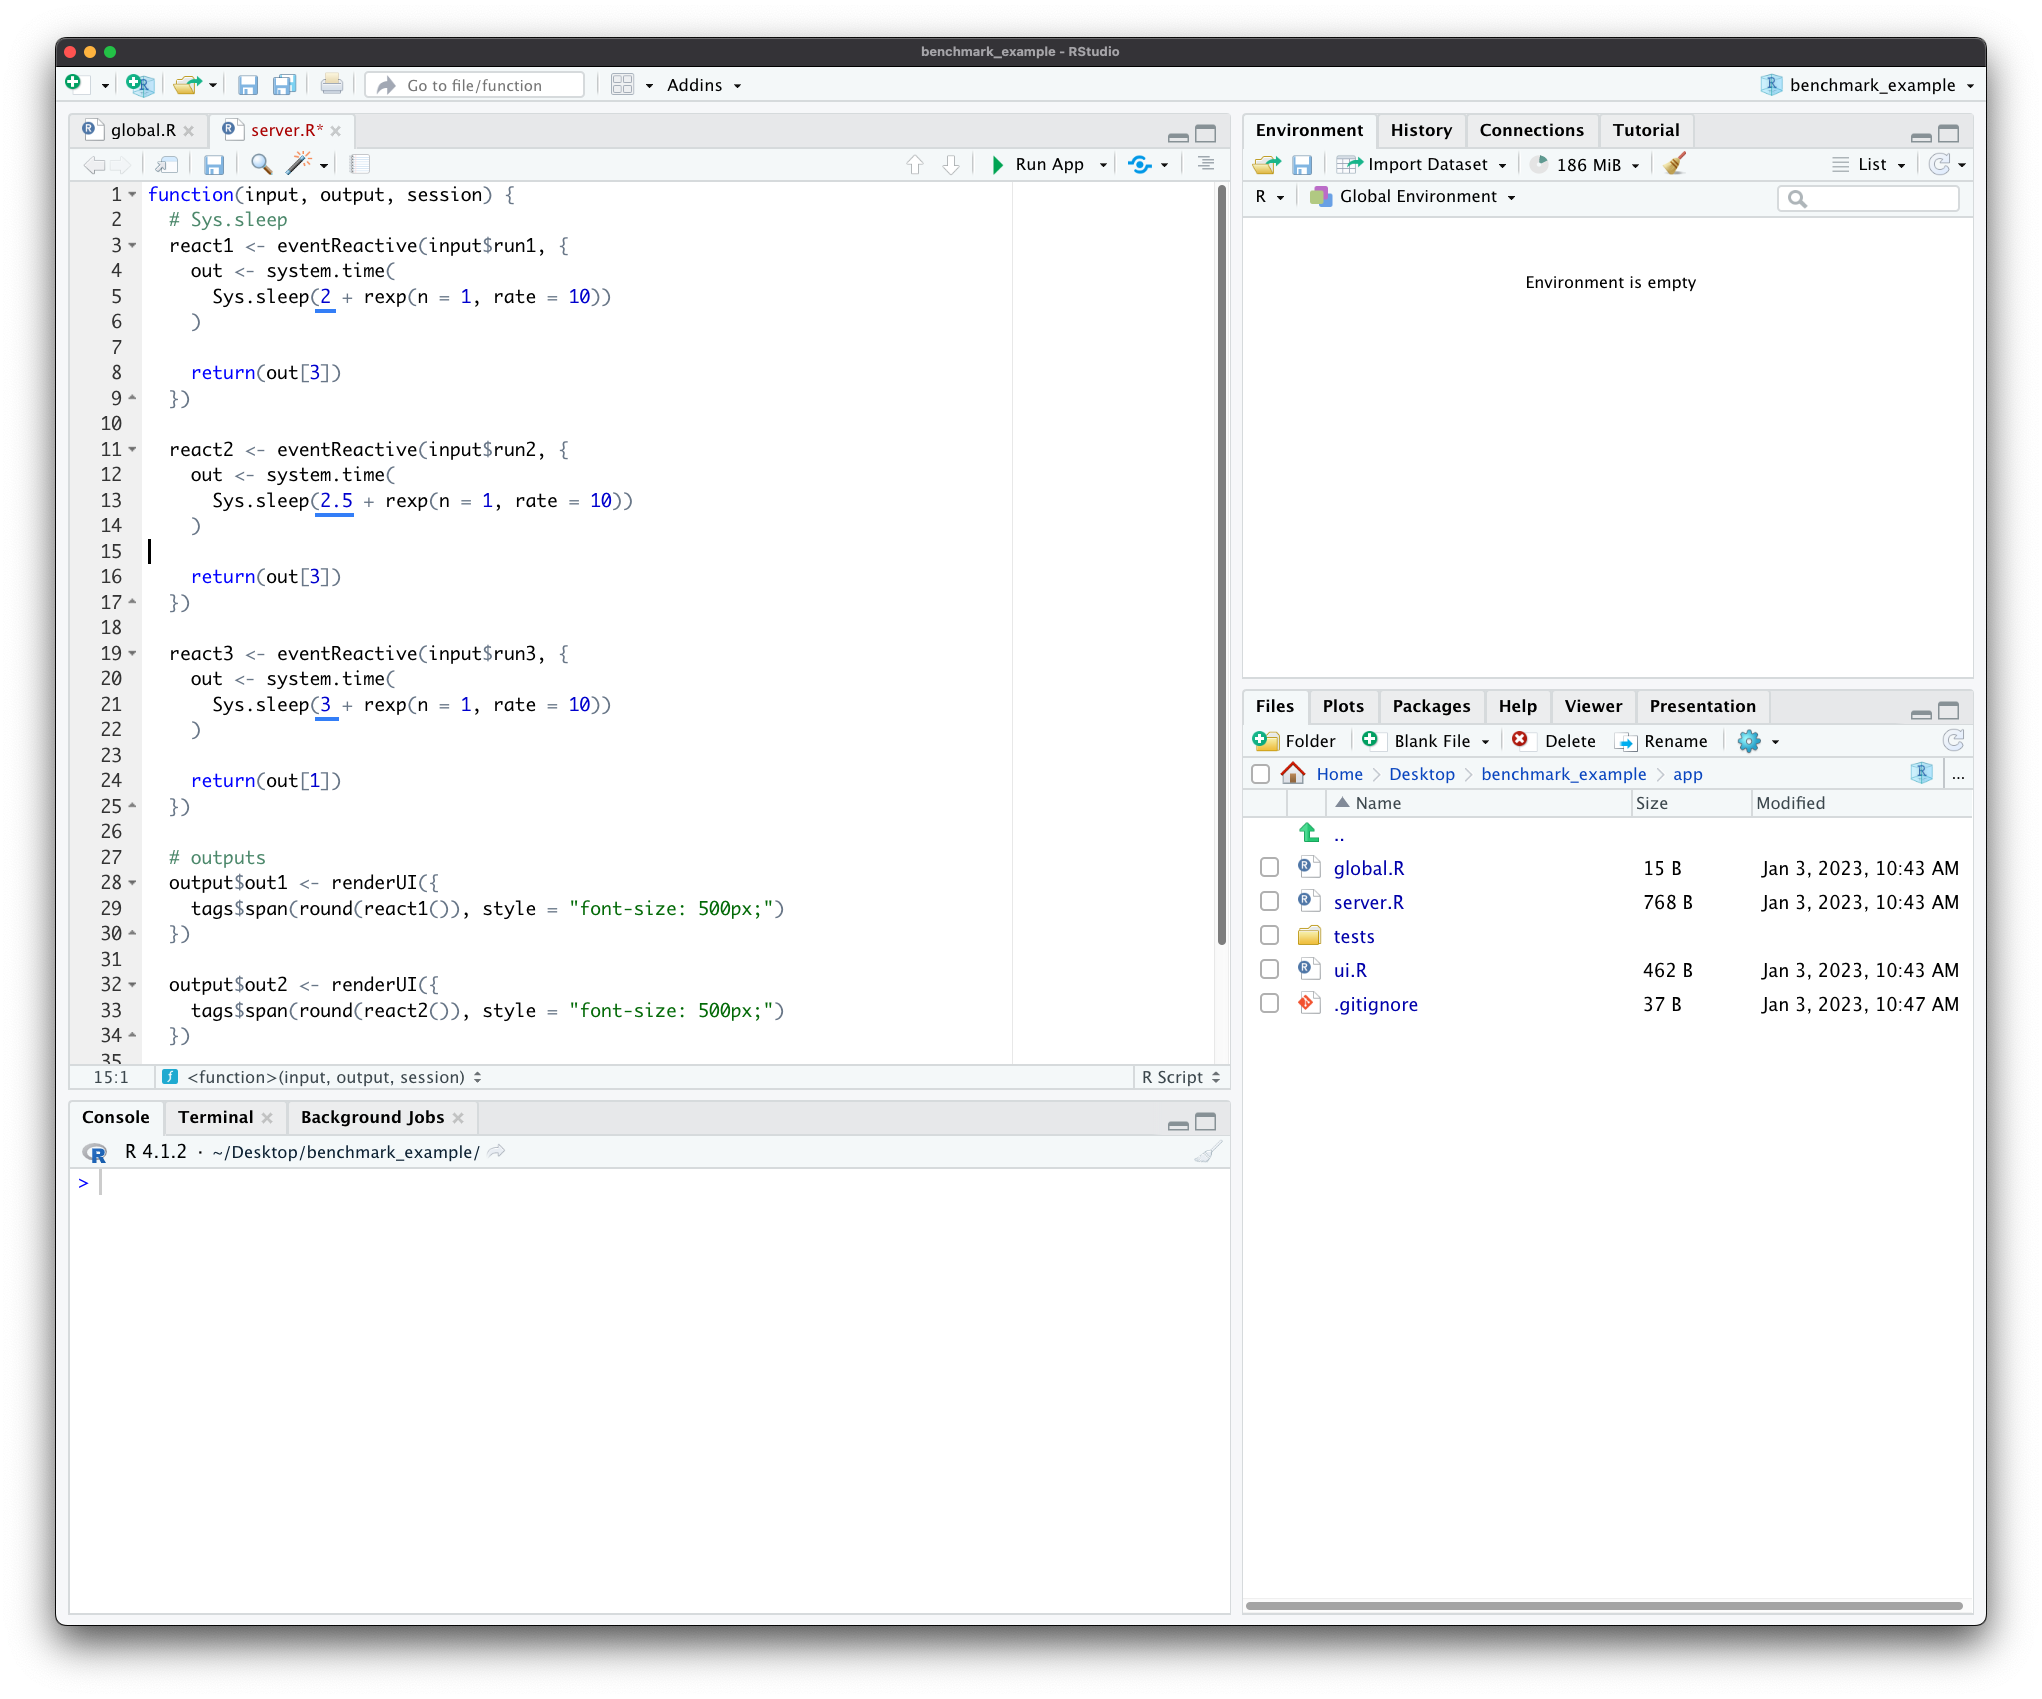
Image 5 – Modified server file with longer sleep times
All that’s left to do is to add this app version to a different Git branch. We’ve named ours develop, but the naming is completely arbitrary:
git checkout -b develop
git add .
git commit -m "Longer sleep times"
App Version #3 – Shorter Sleep Times
Now we’ll make the complete opposite of the second version. In this one, the sleep times will be much shorter, as displayed in the image below:
Image 6 – Modified server file with shorter sleep times
We’ll also commit this version to a dedicated branch – develop2:
git checkout -b develop2
git add .
git commit -m "Shorter sleep times"
Up next, let’s see how to write tests for shiny.benchmark.
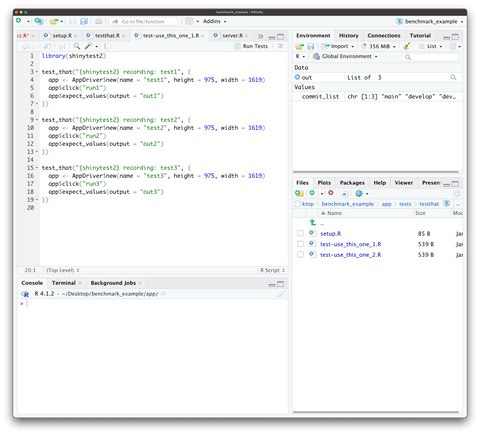
How to Write Tests for shiny.benchmark
Where you’ll put the tests depends on the testing engine you’ll use. We’ll work with shinytest2 in this article, which means the tests are located in app/tests/testthat folder. Here’s what one test file contains:
Image 7 – Contents of a test file
In a nutshell, it instructs how to interact with the app elements and what to expect from them.
You can construct test cases for your Shiny apps in the same way, just make sure to correctly write the input and output IDs.
That’s all we need to run the benchmarks, so let’s do that next.
How to Run Benchmarks with shiny.benchmark
By now, we have three versions of our app committed to dedicated Git branches, and now it’s time to run the benchmarks. Import the R package and declare a list of branch names as shown in the snippet:
library(shiny.benchmark)

commit_list <- c("main", "develop", "develop2")
Now onto the benchmark. The benchmark() function does all the work for you. It can accept many parameters, but we’ll only use a handful:
commit_list– A list of branches on which the benchmark will runshinytest2_dir– A directory in which the actual tests are located. We’re usingshinytest2instead of Cypressuse_renv– Whether or not you’re usingrenvto manage environments. It’s set toTRUEby defaultn_rep– The number of times the tests will be replicated. It’s an optional parameter, but a good one to include for more accurate benchmark metrics
You can check which additional parameters are available, but we’ll stick only to these four today:
> out <- benchmark(
  commit_list = commit_list,
  shinytest2_dir = "tests",
  use_renv = FALSE,
  n_rep = 10
)
Here’s what you’ll see during the benchmark phase (for each branch):
Image 8 – Benchmark running output
Let’s see what the out variable contains after the benchmark runs.
Evaluating Benchmark Results
Run the following R code to print the contents of the out variable:
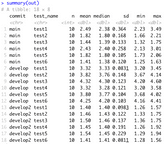
summary(out)Image 9 – Summary of the out variable
Basically, it shows you the performance differences between distinct app versions (branches) and various statistics for each run, such as mean, median, standard deviation, min and max.
Looking at these values in a table format isn’t the best method for drawing conclusions and insights. If you’re more of a visual type, use the plot() function to inspect the differences visually:
plot(out)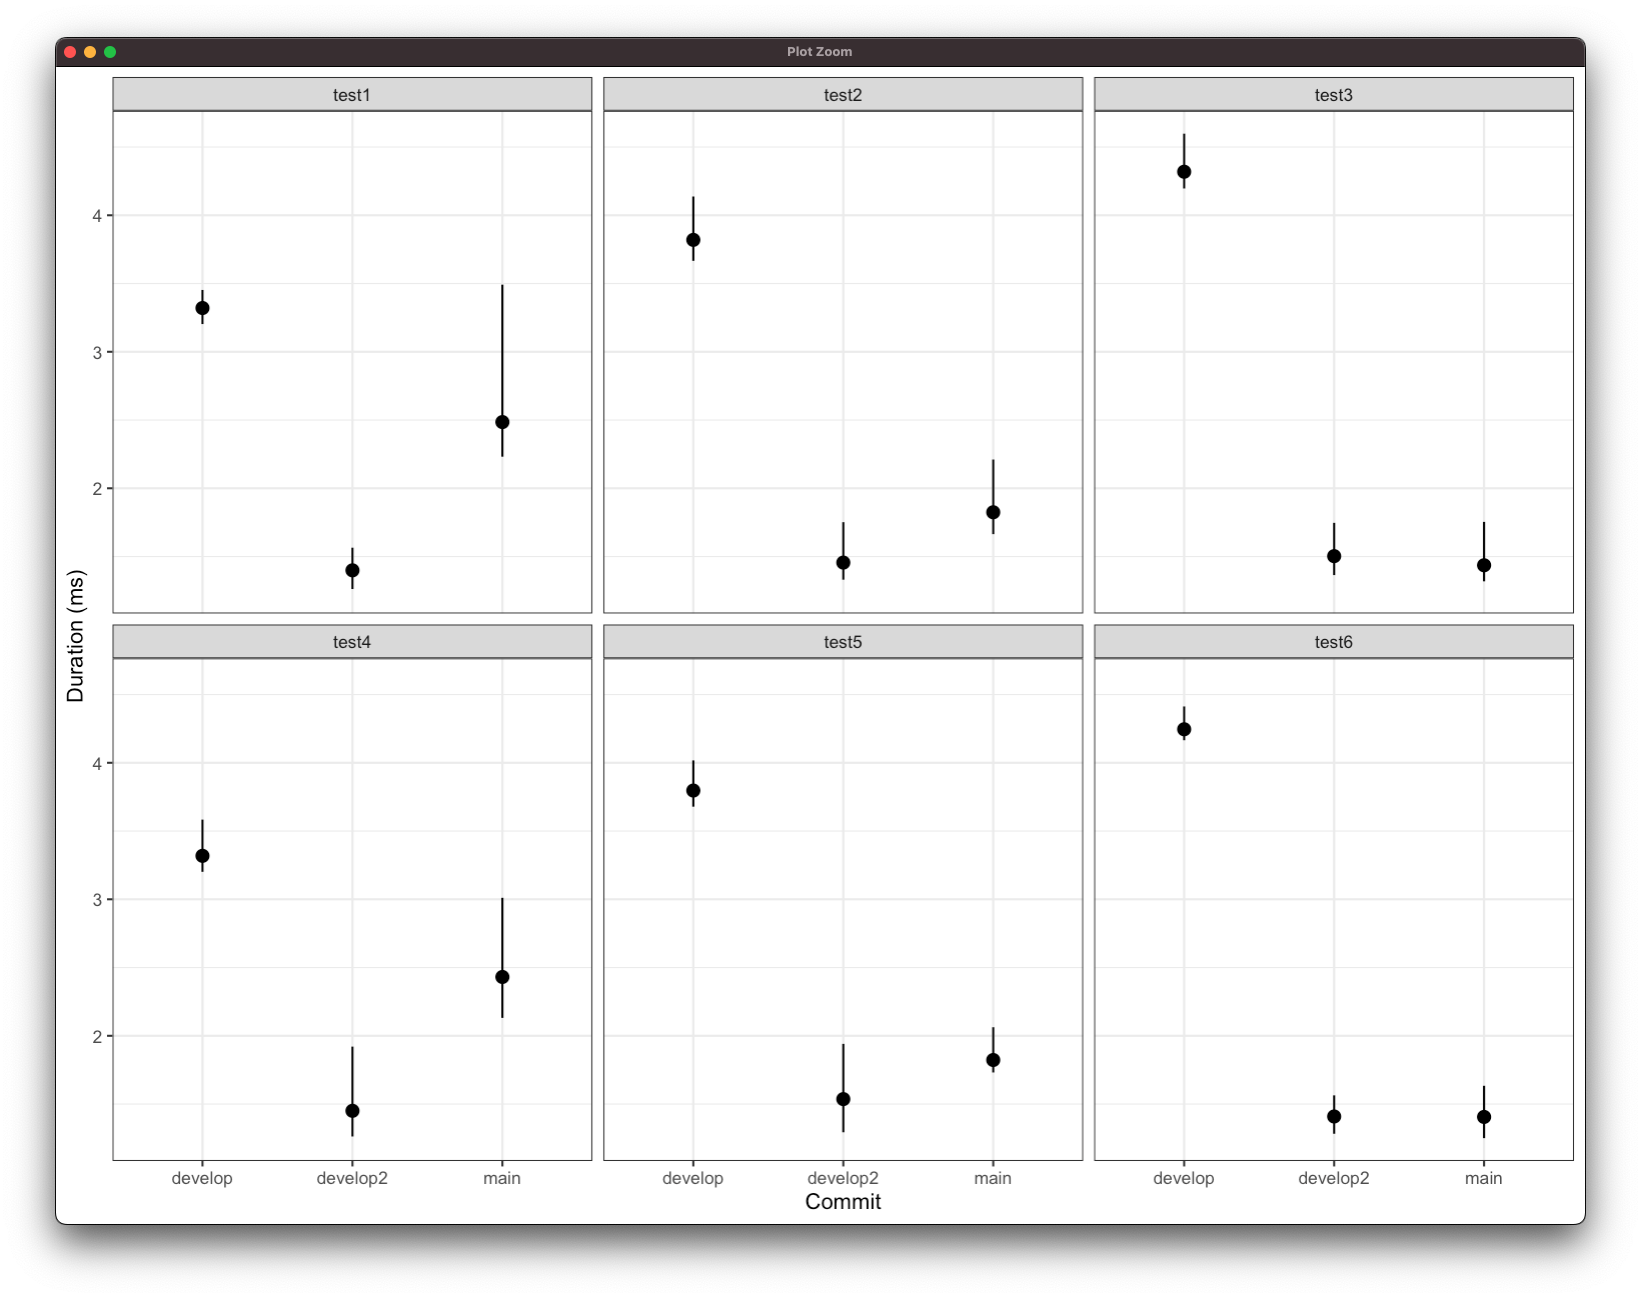
Image 10 – Plot of the out variable
The app version on develop2 branch seems to have the lowest runtime values which is to be expected, as we manually reduced the function sleep times.
You now know how shiny.benchmark works, so let’s make a short summary next.
Summing up the shiny.benchmark R package for measuring app performance
Testing different versions of your R Shiny apps is easier than ever. The shiny.benchmark package is convenient to use because a typical Shiny workflow will include multiple Git branches and unit tests, so running benchmarks won’t take a huge toll on your development time.
We value measuring app performance as crucial when optimizing your code and introducing new features. You want to make sure there are no bottlenecks in your applications and optimize accordingly.
What do you think of the shiny.benchmark package? Have you already used it to compare the performance of your Shiny apps? Please let us know in the comment section below, or reach out to us on Twitter – @appsilon – we’d love to hear your input.
Can you generate MS Word documents from R Shiny tables? Yes, you can, and here’s how.
Contact Us
Project Manager

Get Updates
Subscribe to Shiny Weekly Newsletter
Join 4000+ Shiny enthusiasts to see the latest Shiny news from the R community.