Share
Share Tweet
Tweet Share
Share


If you’re still using Excel or Google Sheets for business, you might already know that Excel is obsolete for many business use-cases. But how do you switch from Excel to R Shiny which is a much better alternative? Getting started is easier than you might think, especially if you’re already an Excel power user.
This article will walk you through a sample migration of an analytics tool built with Excel and Google Sheets to a dashboard built with R Shiny. We’ll show you how to prepare the data for migration, create a simple R Shiny app, view/filter tables in R Shiny, modify a table using SQL, and also how to add interactive filters using the library ShinyWidgets. You don’t need prior experience with R to follow this tutorial.
Updated: April 12, 2022.
- Why Excel is problematic for businesses
- Alternatives to Excel: R and Python
- Migration from Excel to R: getting started
- Creating your first Shiny dashboard
- Migration: SQL and ShinyWidgets
- Learn more
This article shouldn’t take you more than 15 minutes to complete if you’re following along with the code – The final Shiny dashboard has only 45 lines of well-formatted code!. You can download the dataset we use to try it yourself.
Why Excel is a bad choice for businesses
Excel has been an excellent tool for decades due to its relative intuitiveness and the WYSIWYG (What You See Is What You Get) user interface. Still, running an important business process in an Excel workbook in 2022 is a big mistake, as there are a variety of more stable and sophisticated tools readily available.
Here are the reasons why Excel is a bad choice for businesses:
- Excel is prone to human errors.
- It’s not possible to fully version control Excel.
- It’s not safe to keep critical information in Excel.
For more details on each point, read along.
Excel is prone to human errors. Everyone with access to an Excel document can edit all of its features, which can lead to unintentional changes or the removal of crucial functions. As a result, you can easily end up with a broken spreadsheet whenever a user accidentally (or intentionally) changes a parameter. This is a serious issue because it is currently not possible to fully version control Excel. This means that you cannot effectively keep track of changes in an Excel spreadsheet and revert to a previous version if something breaks.
To put it simply – it is not safe to keep a company’s critical information in Excel workbooks, especially when it comes to business analytics. Excel can still be useful as an alternative tool to SQL-based solutions to create simple ‘databases’ as it is very intuitive, and anyone can contribute. However, in the long run, Excel is just too fragile to handle complex business analyses.
Learn more: Excel is Obsolete: Here Are the Top 2 Alternatives from R and Python
Alternatives to Excel: Python and R
To effectively plan your next business move, you need access to features that Excel doesn’t offer, such as integration with machine learning models. You also might need a scalable way of connecting to external data sources via APIs. Selecting a flexible and reliable tool is crucial, due to the variety of analytical approaches that a modern business needs to make decisions.
Therefore, it is necessary to move as many analytical operations as possible away from Excel. There are plenty of better-equipped tools for data analysis and data visualization, and they should not be too difficult to master for someone already proficient in Excel.
Python and R are two of the most popular beginner-friendly programming languages. Many non-IT people find R easier and more intuitive to use than Python. This is good news because R and R Shiny alone can cover the majority of business operations stored in Excel and they really can open the door to modern, ground-breaking data analysis.
Learn More: Better than Excel: Use these R Shiny Packages Instead
Migration from Excel to R: getting started
Every migration starts with proper data preparation. This step might take some time if a company has a lot of Excel workbooks. The most important thing is to extract original data from analyzed data, create tables, and save them in a CSV format. If you’re just starting – start small. Pick one or two CSVs that move the needle for a start. In almost any use case, you don’t have to start with a complete dataset.
Remember:
- When dealing with multiple sheets in a workbook, you need to combine them into one or divide them into different CSVs.
- When combining all sheets from the workbook into one table, make sure all sheets have the same number of columns and the same column names.
It would make sense to switch from CSV to SQL in the future, but using CSV is not a dealbreaker in the beginning. Moreover, you’ve likely performed some useful and effective analytical operations within Excel. Don’t get rid of them just yet. By all means, analyze/verify these operations one more time, and describe their logic in detail (to recreate it later in R).
Sample case: Job hunt analysis
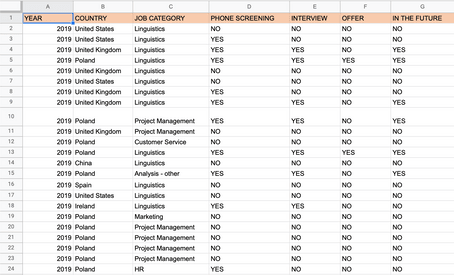
A couple of years back, one of our consultants was searching for a full-time job, and they started tracking application processes to see a more accurate picture of their career prospects – primarily to find out which companies/industries find a single profile interesting. Information about all applications sent in 2019 and 2020 were stored in two Excel sheets (original data) and one in Google Sheets (analysis). Let’s take a quick preview of this data.
Original data:
Image 1 – Original source data
Analysis:
Image 2 – Original analysis data
As you can see in the screen recording above, the dashboard works fine. However, there are some issues we encountered while using and maintaining it:
- When sharing the analysis with others, it is impossible to filter data without granting editing rights to users.
- We can’t select multiple options in filters, e.g. we are not able to check the results for Poland and Spain simultaneously.
- We need to maintain four different tables and functions that show almost the same thing.
Because of the reasons above, it makes sense to migrate this dashboard to R Shiny and see if these problems can be eliminated.
Data preparation
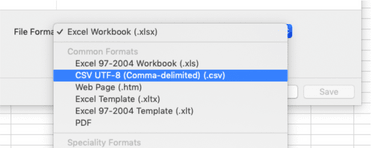
In this case, data preparation was fairly easy. Two sheets were merged into one, some values got replaced (YES -> 1, NO -> empty cell) using Find and Replace, and the data was saved to a CSV file:
Image 3 – Saving Excel workbook as a CSV file
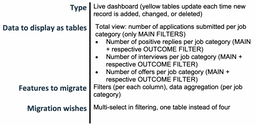
The next logical step is describing the features we need to migrate from Excel to R Shiny. The following table summarizes the steps pretty well:
Image 4 – Features needed to migrate from Excel to R Shiny
Loading a dataset
To start the migration process, we downloaded RStudio (a free development environment for R from our partner RStudio, PBC), found the CSV file we wanted to use, and imported it into RStudio:
Image 5 – Loading a dataset in RStudio
After a successful import, the file appeared in the Global Environment. R had no problem with recognizing the CSV table.
New to R or want to speed up your workflow? Check out our favorite RStudio Shortcuts and Tricks.
Creating your first R Shiny dashboard
Let’s start simple with something that remotely resembles the original dashboard. The main goal is to make a simple app that displays the source data and filters it by Job Category.
It’s important to understand the two main components of an R Shiny app – the UI (User Interface) and the server. UI is a graphic layout of an app – everything the user sees on a webpage. The server is the backend of an application. The app is stored on the computer that runs R in the form of a page that can be viewed in a web browser.
If you are a beginner with R Shiny, get started with our Video Tutorial to Create and Customize a Simple Shiny Dashboard
Note: To share the R Shiny app with others, you either need to send them a copy of a script or host this page via an external web server.
To start, let’s use the most basic Shiny app template:
Defining input and output
Image 6 – Basic Shiny app
Input is everything the user can interact with on a website. To name a few:
- select boxes –
selectInput() - radio buttons –
radioButtons() - sliders –
sliderInput() - date ranges –
dateRangeInput() - passwords –
passwordInput()
Each input must have an inputId (local name, e.g. ‘value’), and a label (a description that will be displayed in an app, e.g. ‘Select value’). In addition, depending on the type of input, you can provide additional parameters that will specify/limit the actions a user can perform. For more on defining input and output, and other aspects of Shiny, read RStudio’s tutorial.
In the first draft of the app, let’s create a reactive select box from which the user can choose any job category that appears in the dataset. Therefore, besides defining inputId and a label we need a list of choices for a dropdown list (choices = TableName$ColumnName):
On the other hand, output is the second argument in fluidPage(). In this case, it is the result of actions taken by the user in inputs. It can be displayed in the form of a:
- Graph –
plotOutput(), - Table –
tableOutput(), - Text –
textOutput(), - Image –
imageOutput(),
and so on. Just like input, the output needs to have an ID – outputId. We’ll display the results as a table, so let’s use the tableOutput() function and name our reactive output jobhuntData:
Like many basic Shiny apps, our draft Shiny app is quite ugly by default. Let’s fix this with some elements: titlePanel(), sidebarLayout(), sidebarPanel(), and mainPanel().
At this point, after adding all elements to a fluidPage() function, our code looks like this:
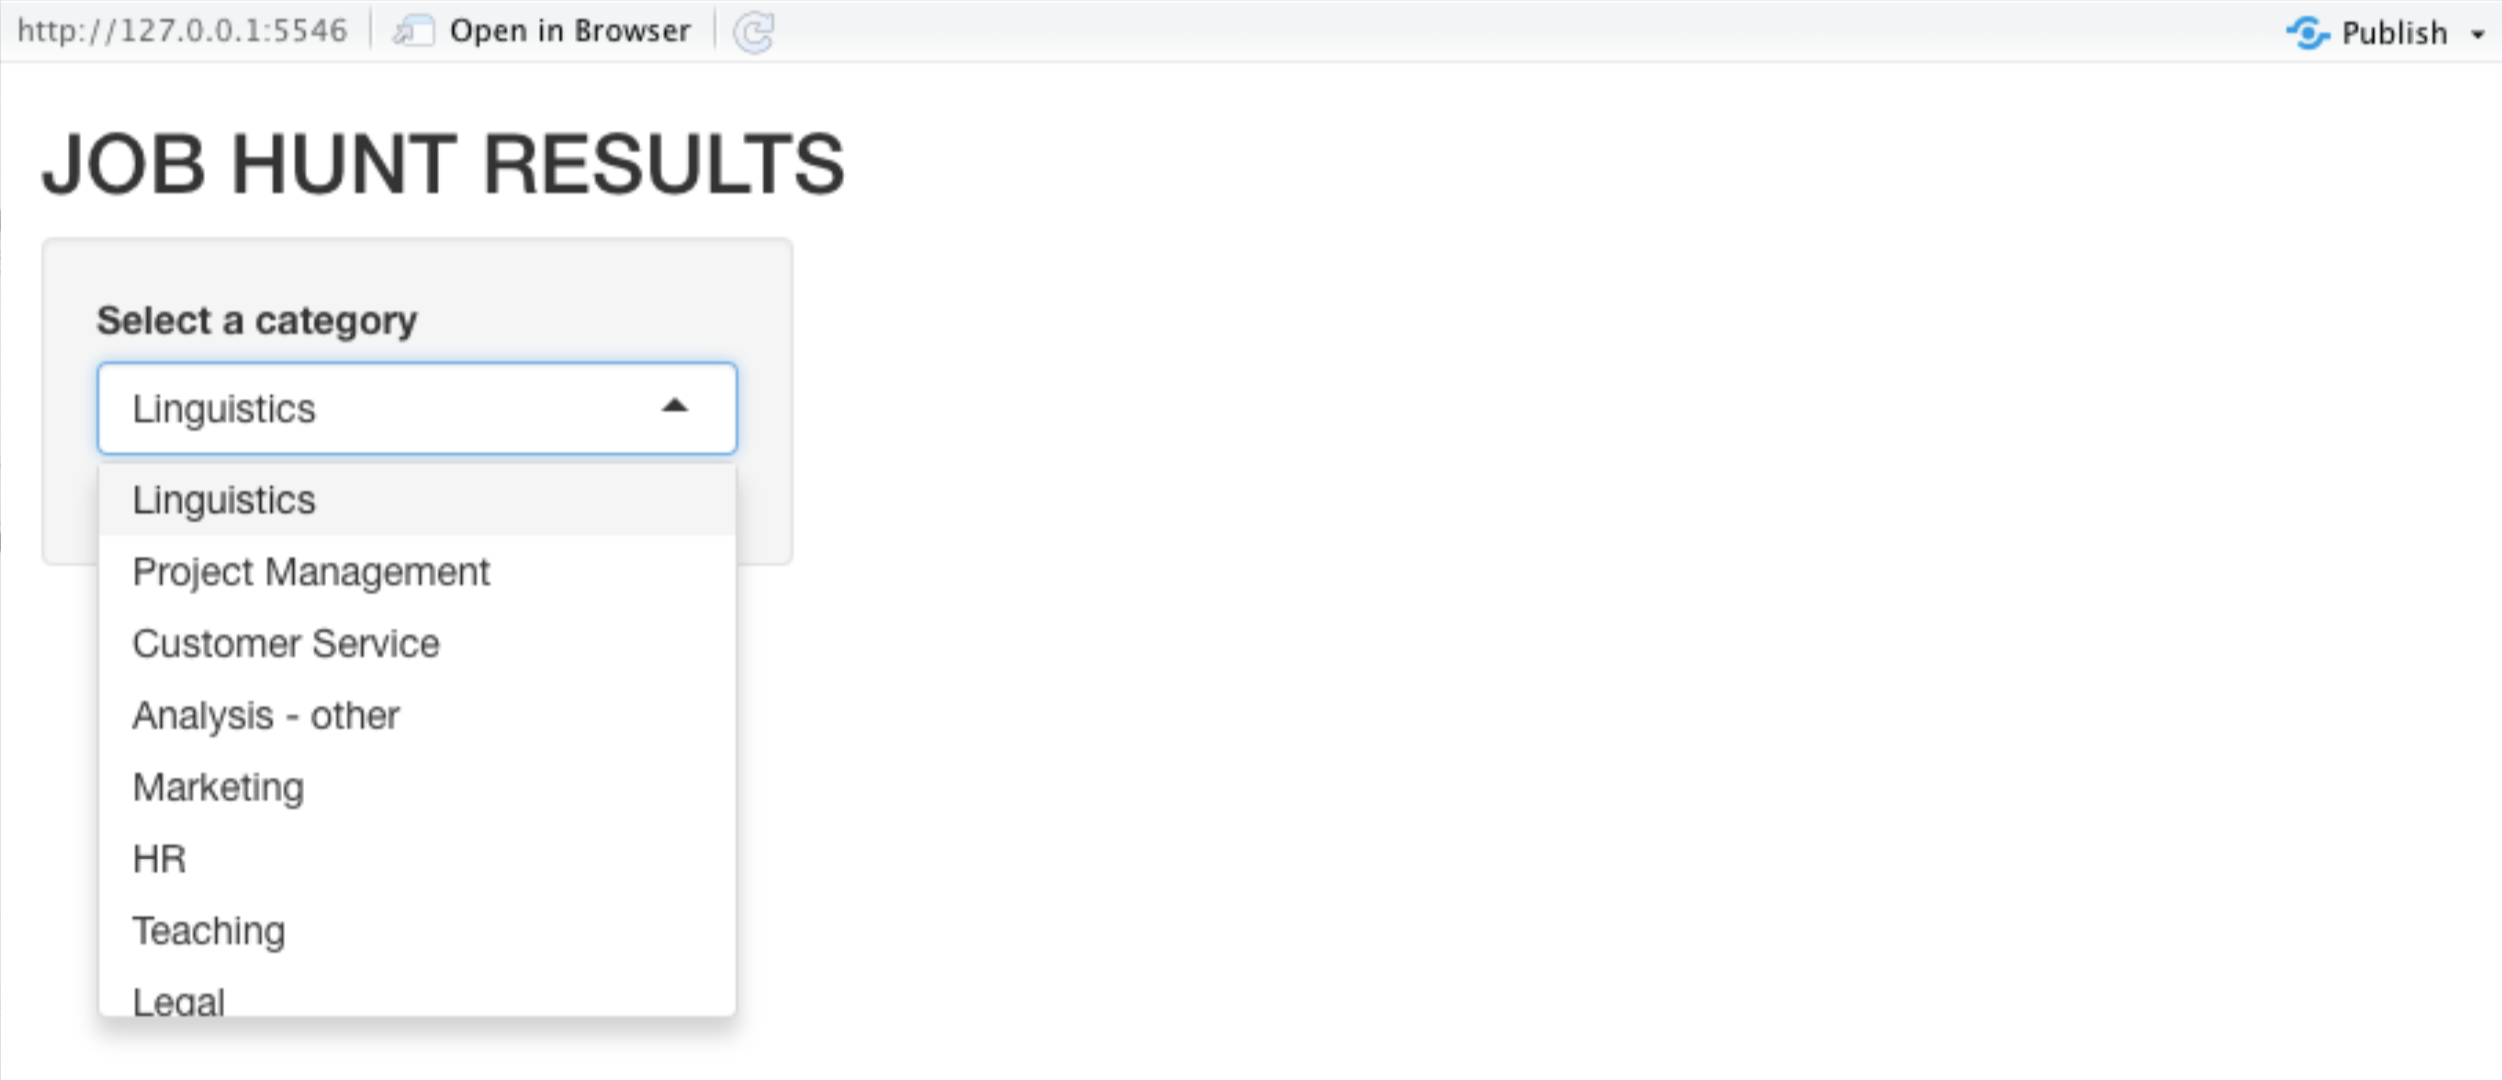
Image 7 – Dropdown menu in R Shiny app
We can see the filter, but there is no table yet. This is because R Shiny does not know what kind of table we want to generate. Let’s introduce server requirements to address this.
Want to Make a Beautiful Shiny App Fast? Leverage Appsilon’s R Shiny templates that are completely free.
How to use Shiny Server
To build the first draft of the app, we need to create a source for the tableOutput() function by using Render Functions:
renderImage()to render an image,renderPlot()if you want to render a plot/graph,renderText()to display text
and so on.
Below you can see how we assigned the outputId (jobhuntData) to a function that renders the desired output – in our case, renderTable() to render a table. Inside this function, we specified the data that we want to see in the table. Please mind that input$jobcategory refers to the Input Function from the UI, and it is always equal to the current value of the input (a value selected by a user).
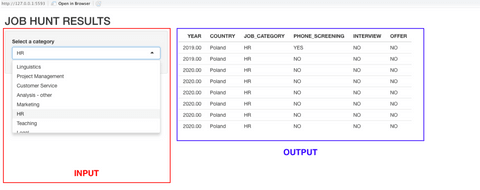
The current version of the app does not look amazing, but we can see that the correct data is shown, and the server generates proper output according to the input provided by the user:
Image 8 – Reactive R Shiny app
Migration: SQL and ShinyWidgets
Now that we know how to create a basic dashboard in R Shiny, we are going to migrate other features from our original dashboard. First and foremost, we had to not only create filters for all columns but also aggregate/group data by YEAR and COUNTRY. There are several ways to modify the dataset in R, but we decided to do it using an SQL SELECT statement. SQL is another topic on its own, but we recommend that you learn the basics of SQL if you work with data on a daily (or even weekly) basis.
This is one of the SQL statements we used to create an aggregated view in Google Sheets:

Image 9 – SQL statement used in Google Sheets
Below is the logic that we applied in R using the sqldf library. It enables us to see how many phone screenings, interviews, and offers we had each year in every country:
This is what the new table aggregated_data looks like:
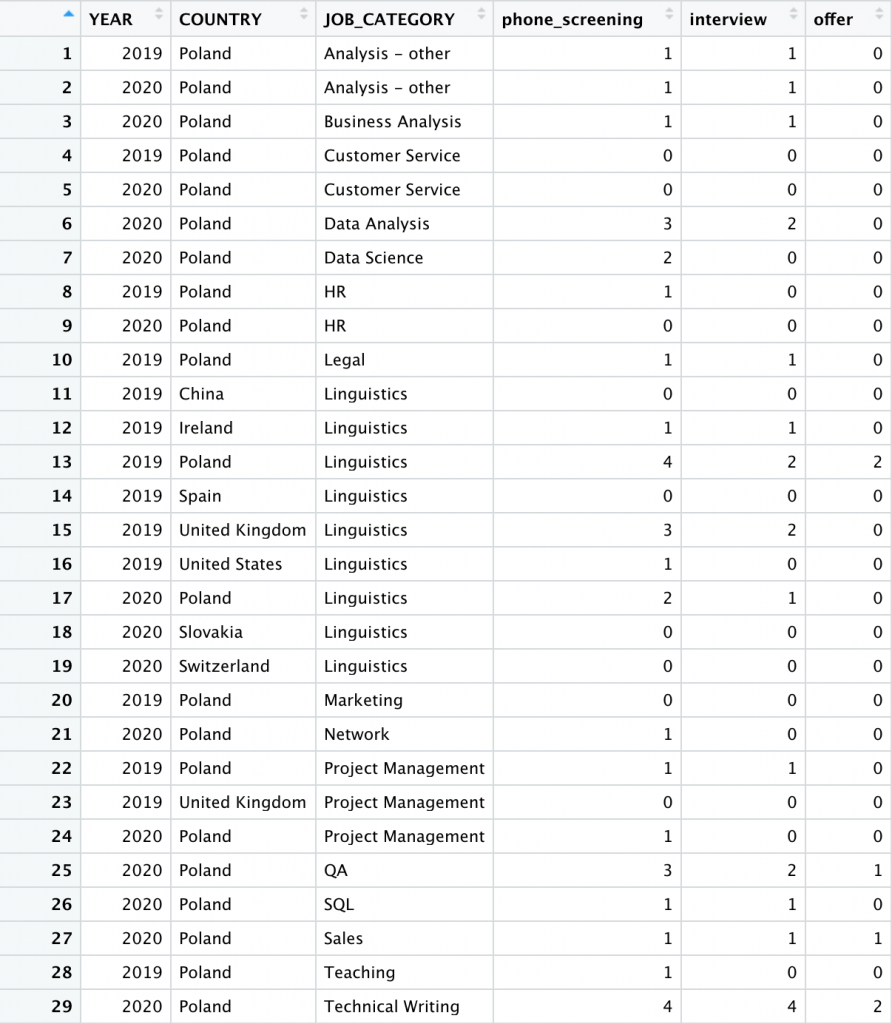
Image 10 – Aggregated data table
Adding multiple filters that are conditional can be a very difficult task, but the ShinyWidgets library offers a perfect solution: selectizeGroup-module. Having imported ShinyWidgets, we’ve replaced selectInput() with selecticizeGroupUI() and added one more function – callModule(). This way we have eliminated the possibility of choosing a combination that does not exist. Below you can see the entire solution:
Image 11 – Final Shiny app
Switching from Excel to R Shiny: key takeaways
Working with a new tool like R Shiny can be intimidating at first, but in some ways, it can be even easier to learn and understand than Excel or Google Sheets. It is more flexible in terms of adding new features or modifying existing ones. Because we replaced four tables with one, the dashboard not only looks better than our Excel and Google Sheets tool – it is also much easier to use.
Moreover, we managed to create an app where the user is in complete control of the displayed data but does not have access to the backend. This means we do not need to worry about non-technical users making accidental changes to the source code or breaking the app. We can also apply version control and store the source code of the app on services like GitHub in a way that allows us to safely revert to previous versions. This way, anyone with whom I want to share my code can download it and make contributions in a controlled environment.
Interested in learning R Shiny further? Here’s how to start a career as an R Shiny developer.
If you need a PoC fast or an improvement on an existing concept, reach out to us. Appsilon is a global leader in R/Shiny development. And the Appsilon team plays an active role within the R/Shiny community, developing and maintaining open source packages and Shiny templates. From design to infrastructure, our Shiny tools can be used to build efficient, beautiful Shiny applications that scale. We’ve got the skillset to solve the most challenging of problems and we’re an RStudio Full Service Certified Partner.
This article was originally written by Zuzanna Danowska with further edits from Appsilon team members Marcin Dubel and Dario Radečić.
Contact Us
Project Manager

Get Updates
Subscribe to Shiny Weekly Newsletter
Join 4000+ Shiny enthusiasts to see the latest Shiny news from the R community.