Appsilon Blog for R Shiny Apps, Computer Vision, and Open Source Tools
Tag: covid-19


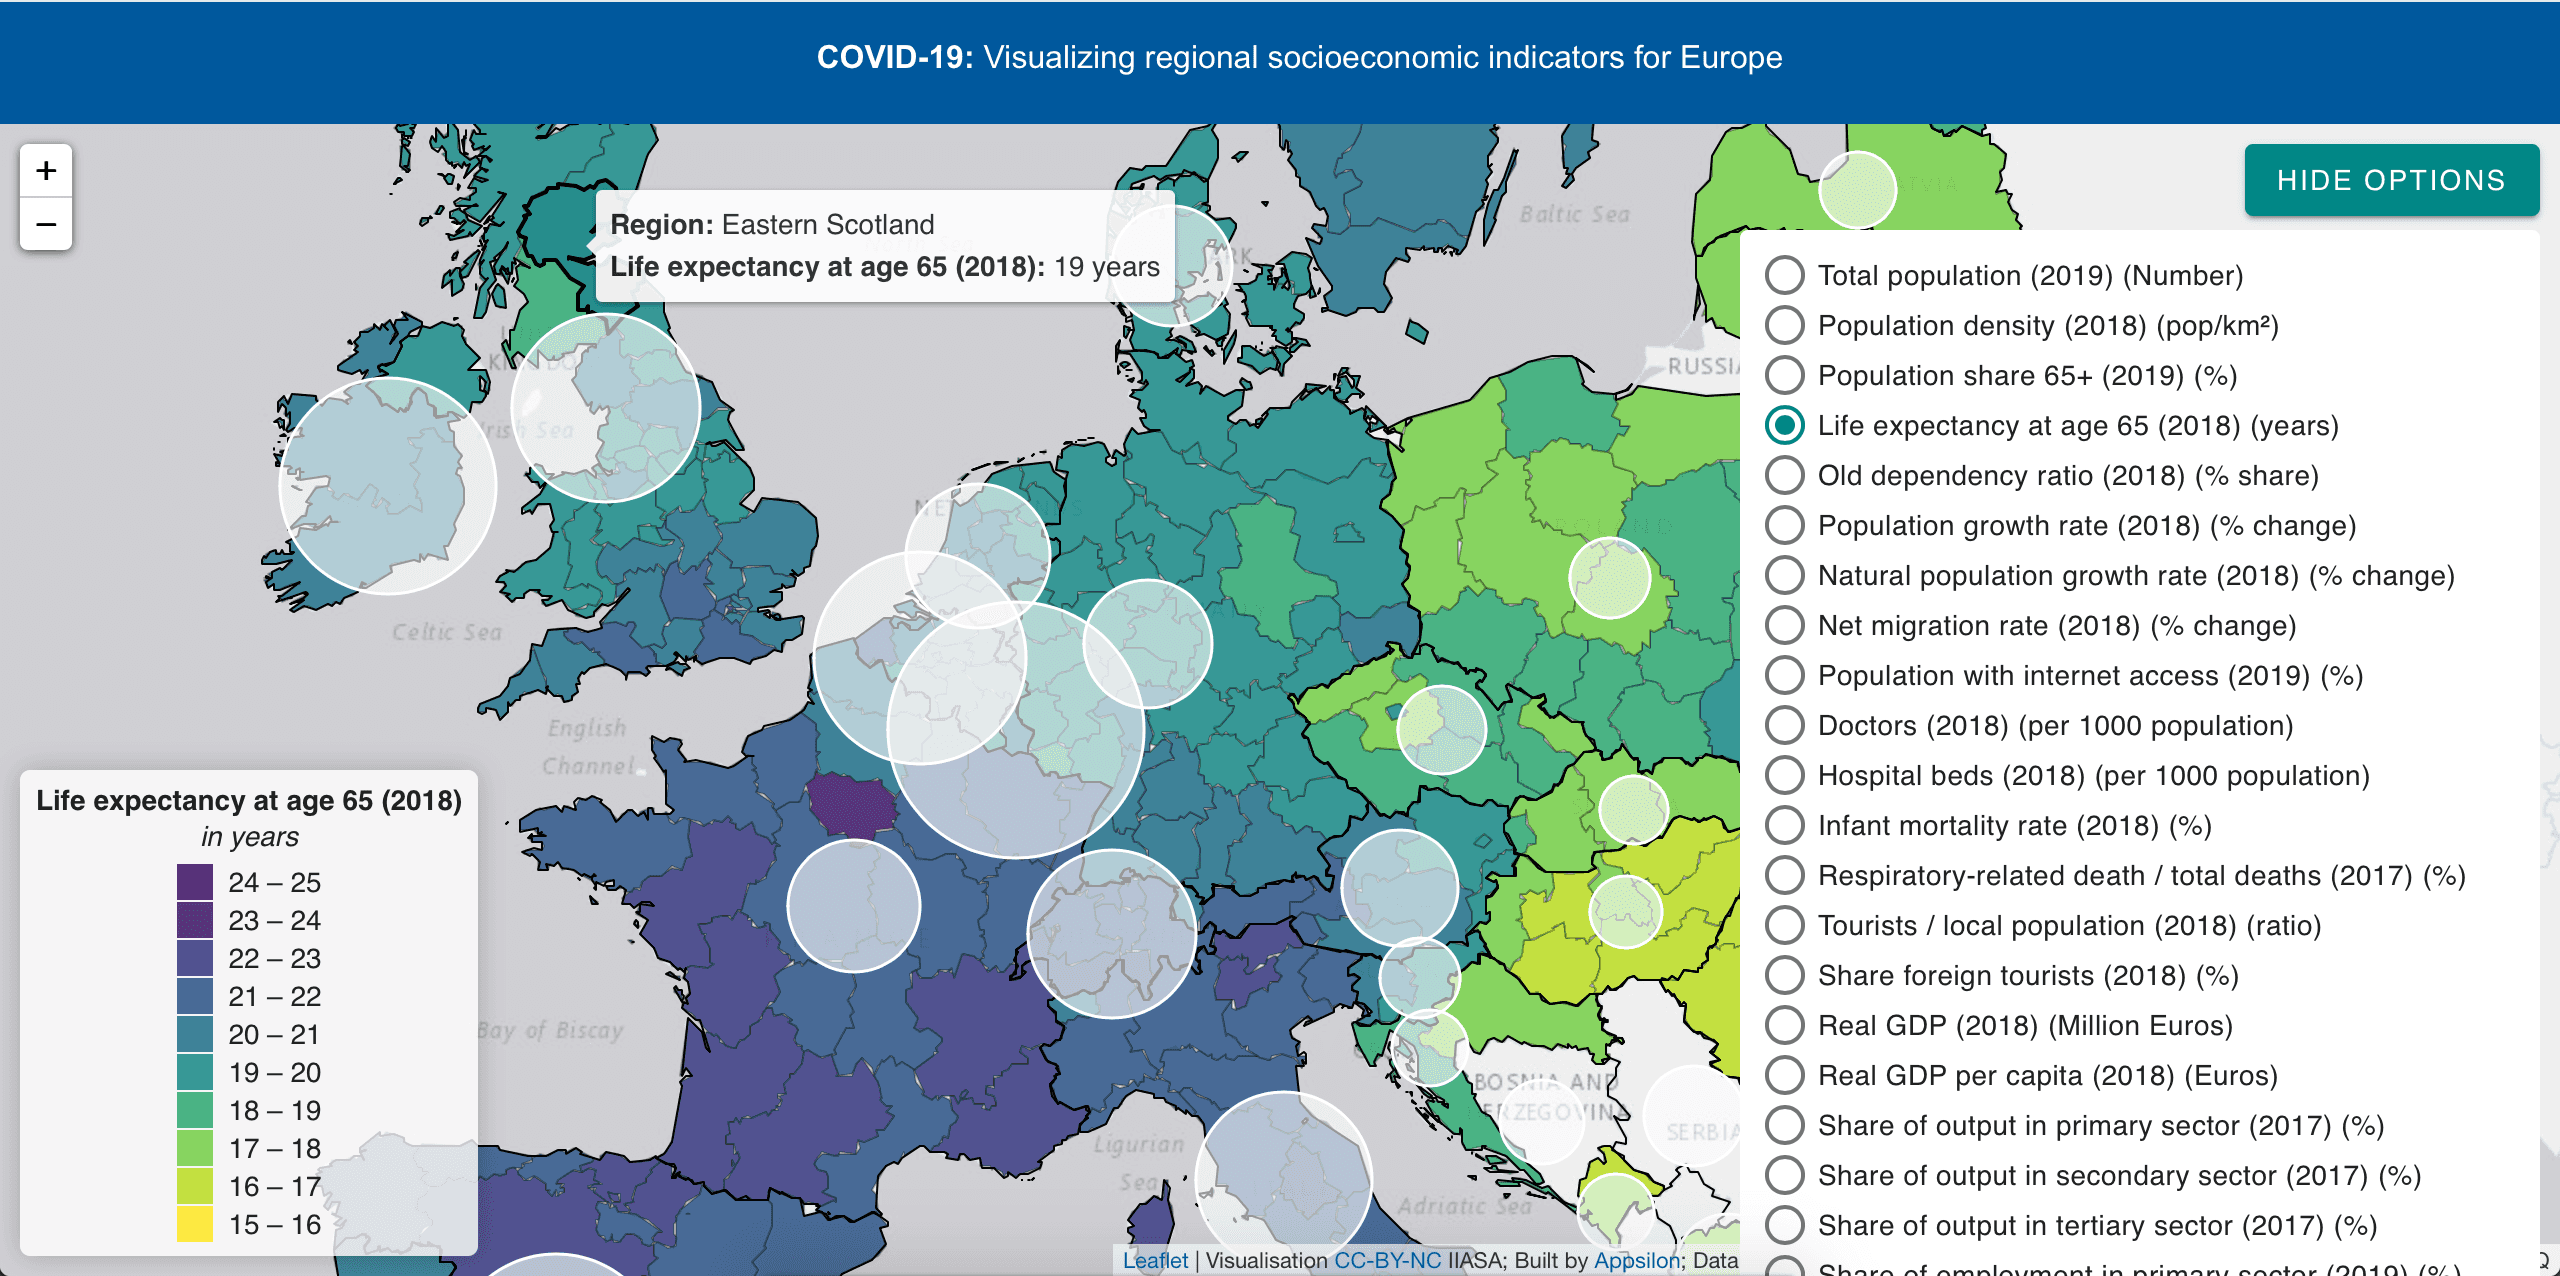
IIASA Collaboration: An Interactive Map for COVID-19 Public Policy Decisions
Appsilon created a dashboard in collaboration the International Institute for Applied Systems Analysis to deliver information about COVID-19 to policymakers. We implemented the solution with Python and Svelte.
10 June 2020

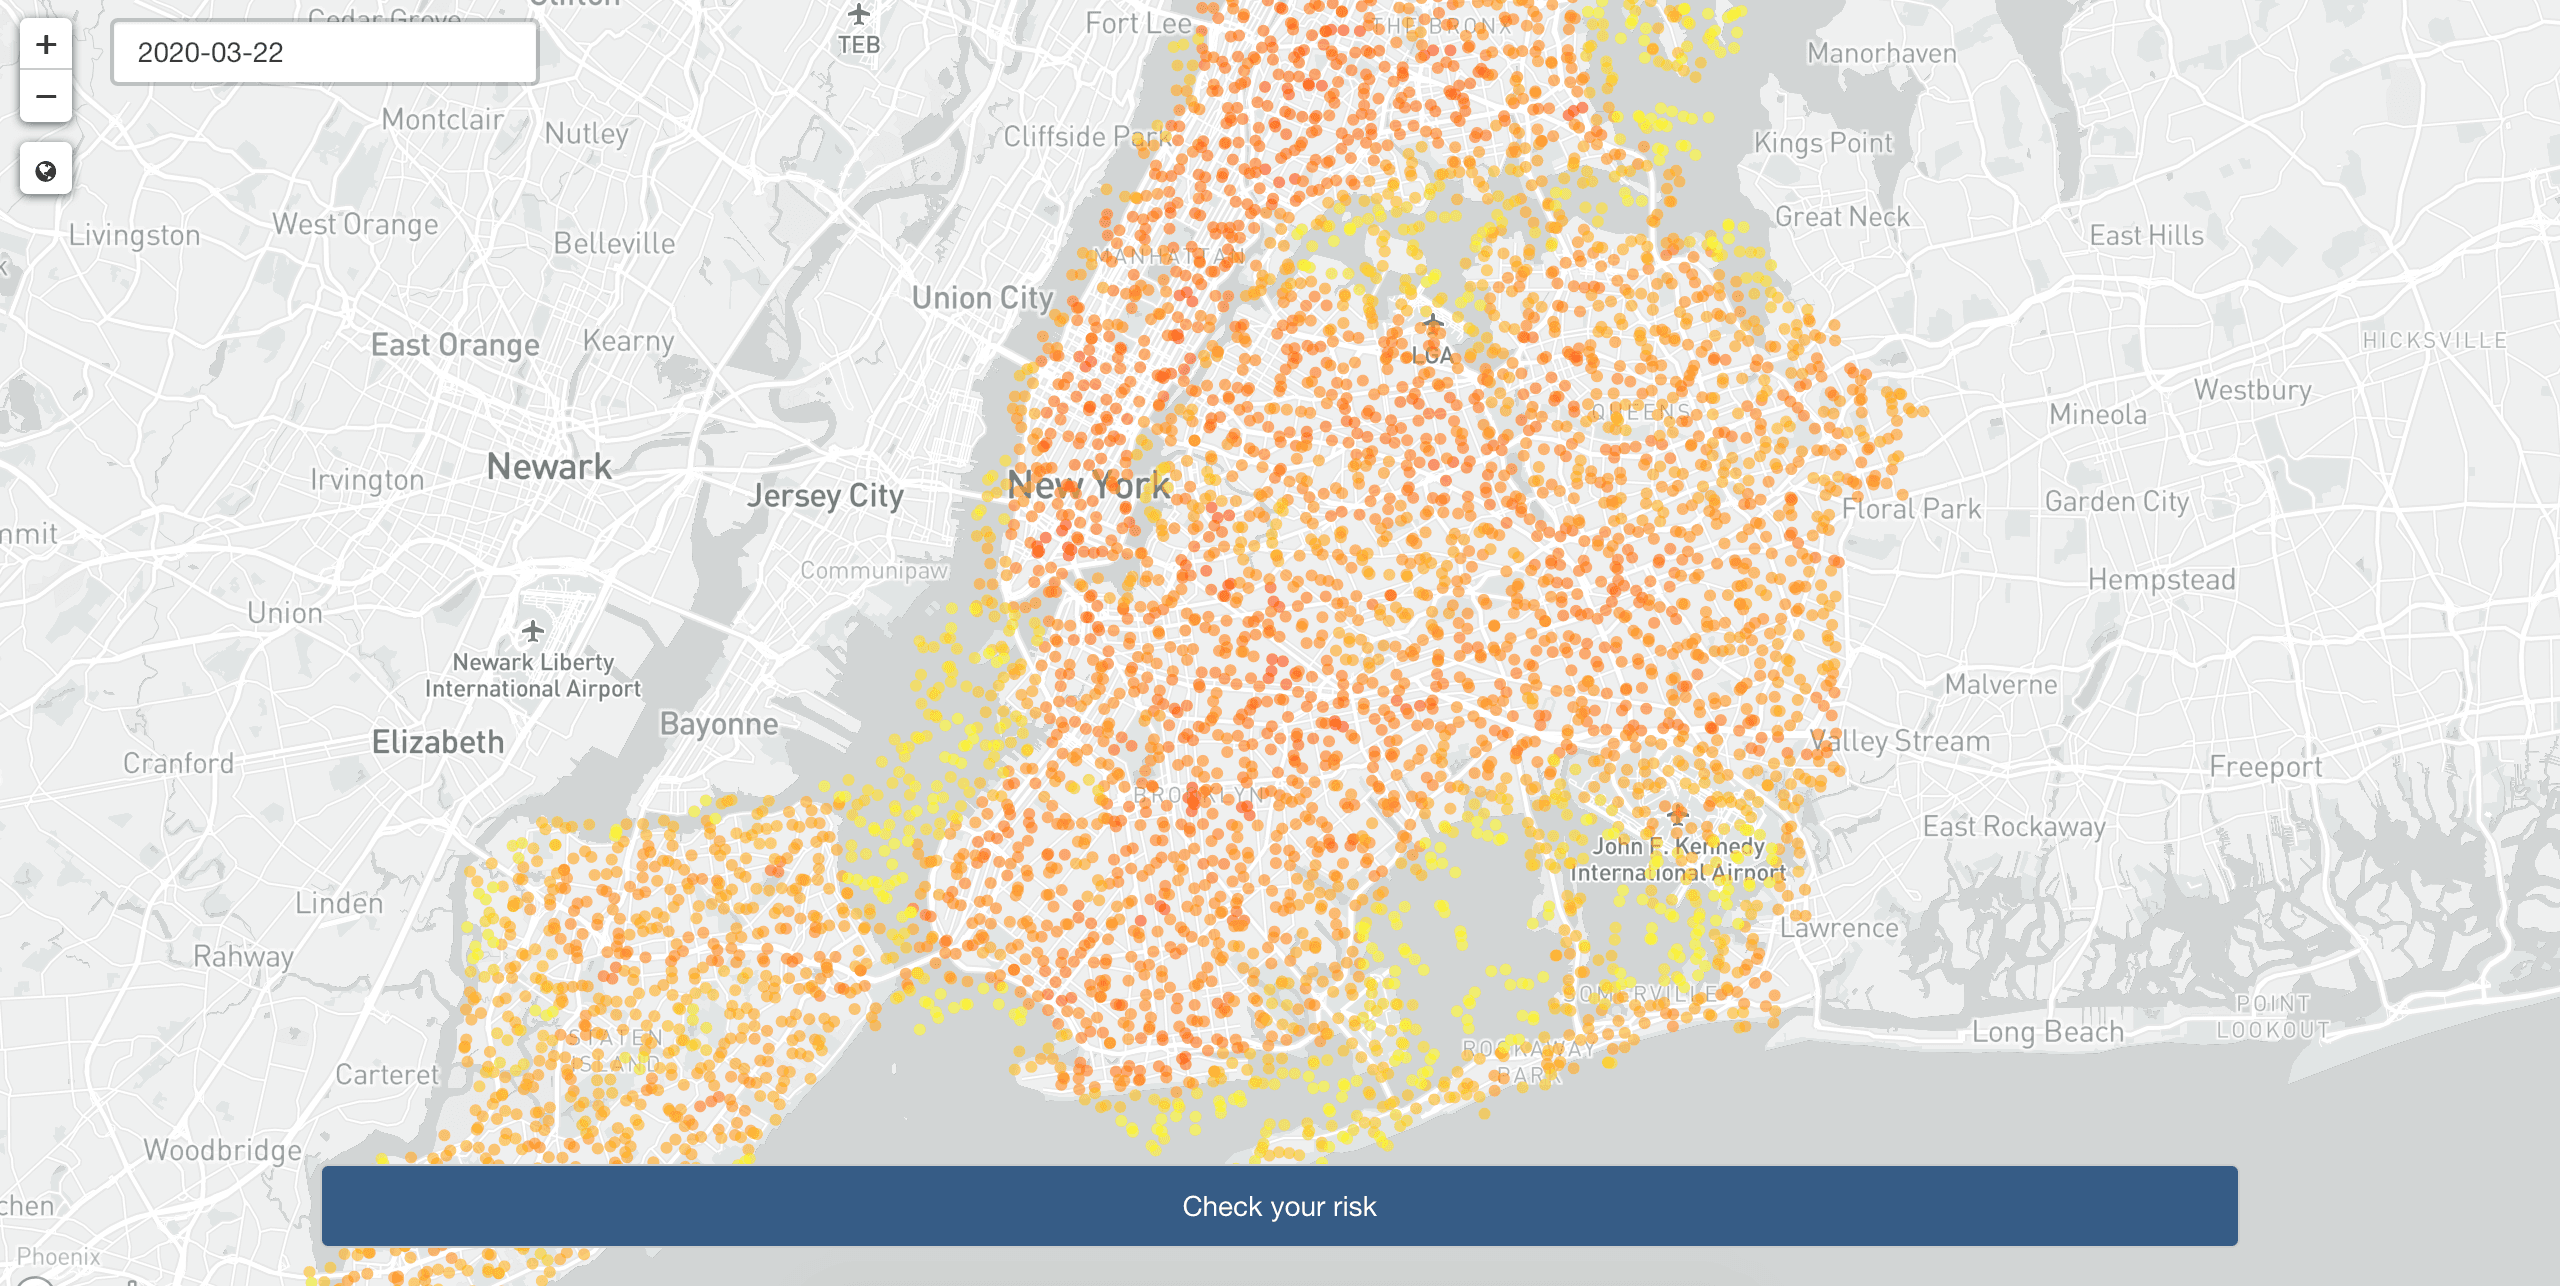
COVID-19 Risk Heat Maps with Location Data, Apache Arrow, Markov Chain Modeling, and R Shiny
Our submission to the Pandemic Response Hackathon (CoronaRank) is inspired by Google’s PageRank and utilizes geolocation data in the Apache Parquet format from Veraset for effective exposure risk assessment using R and Markov Chain modeling.
27 April 2020

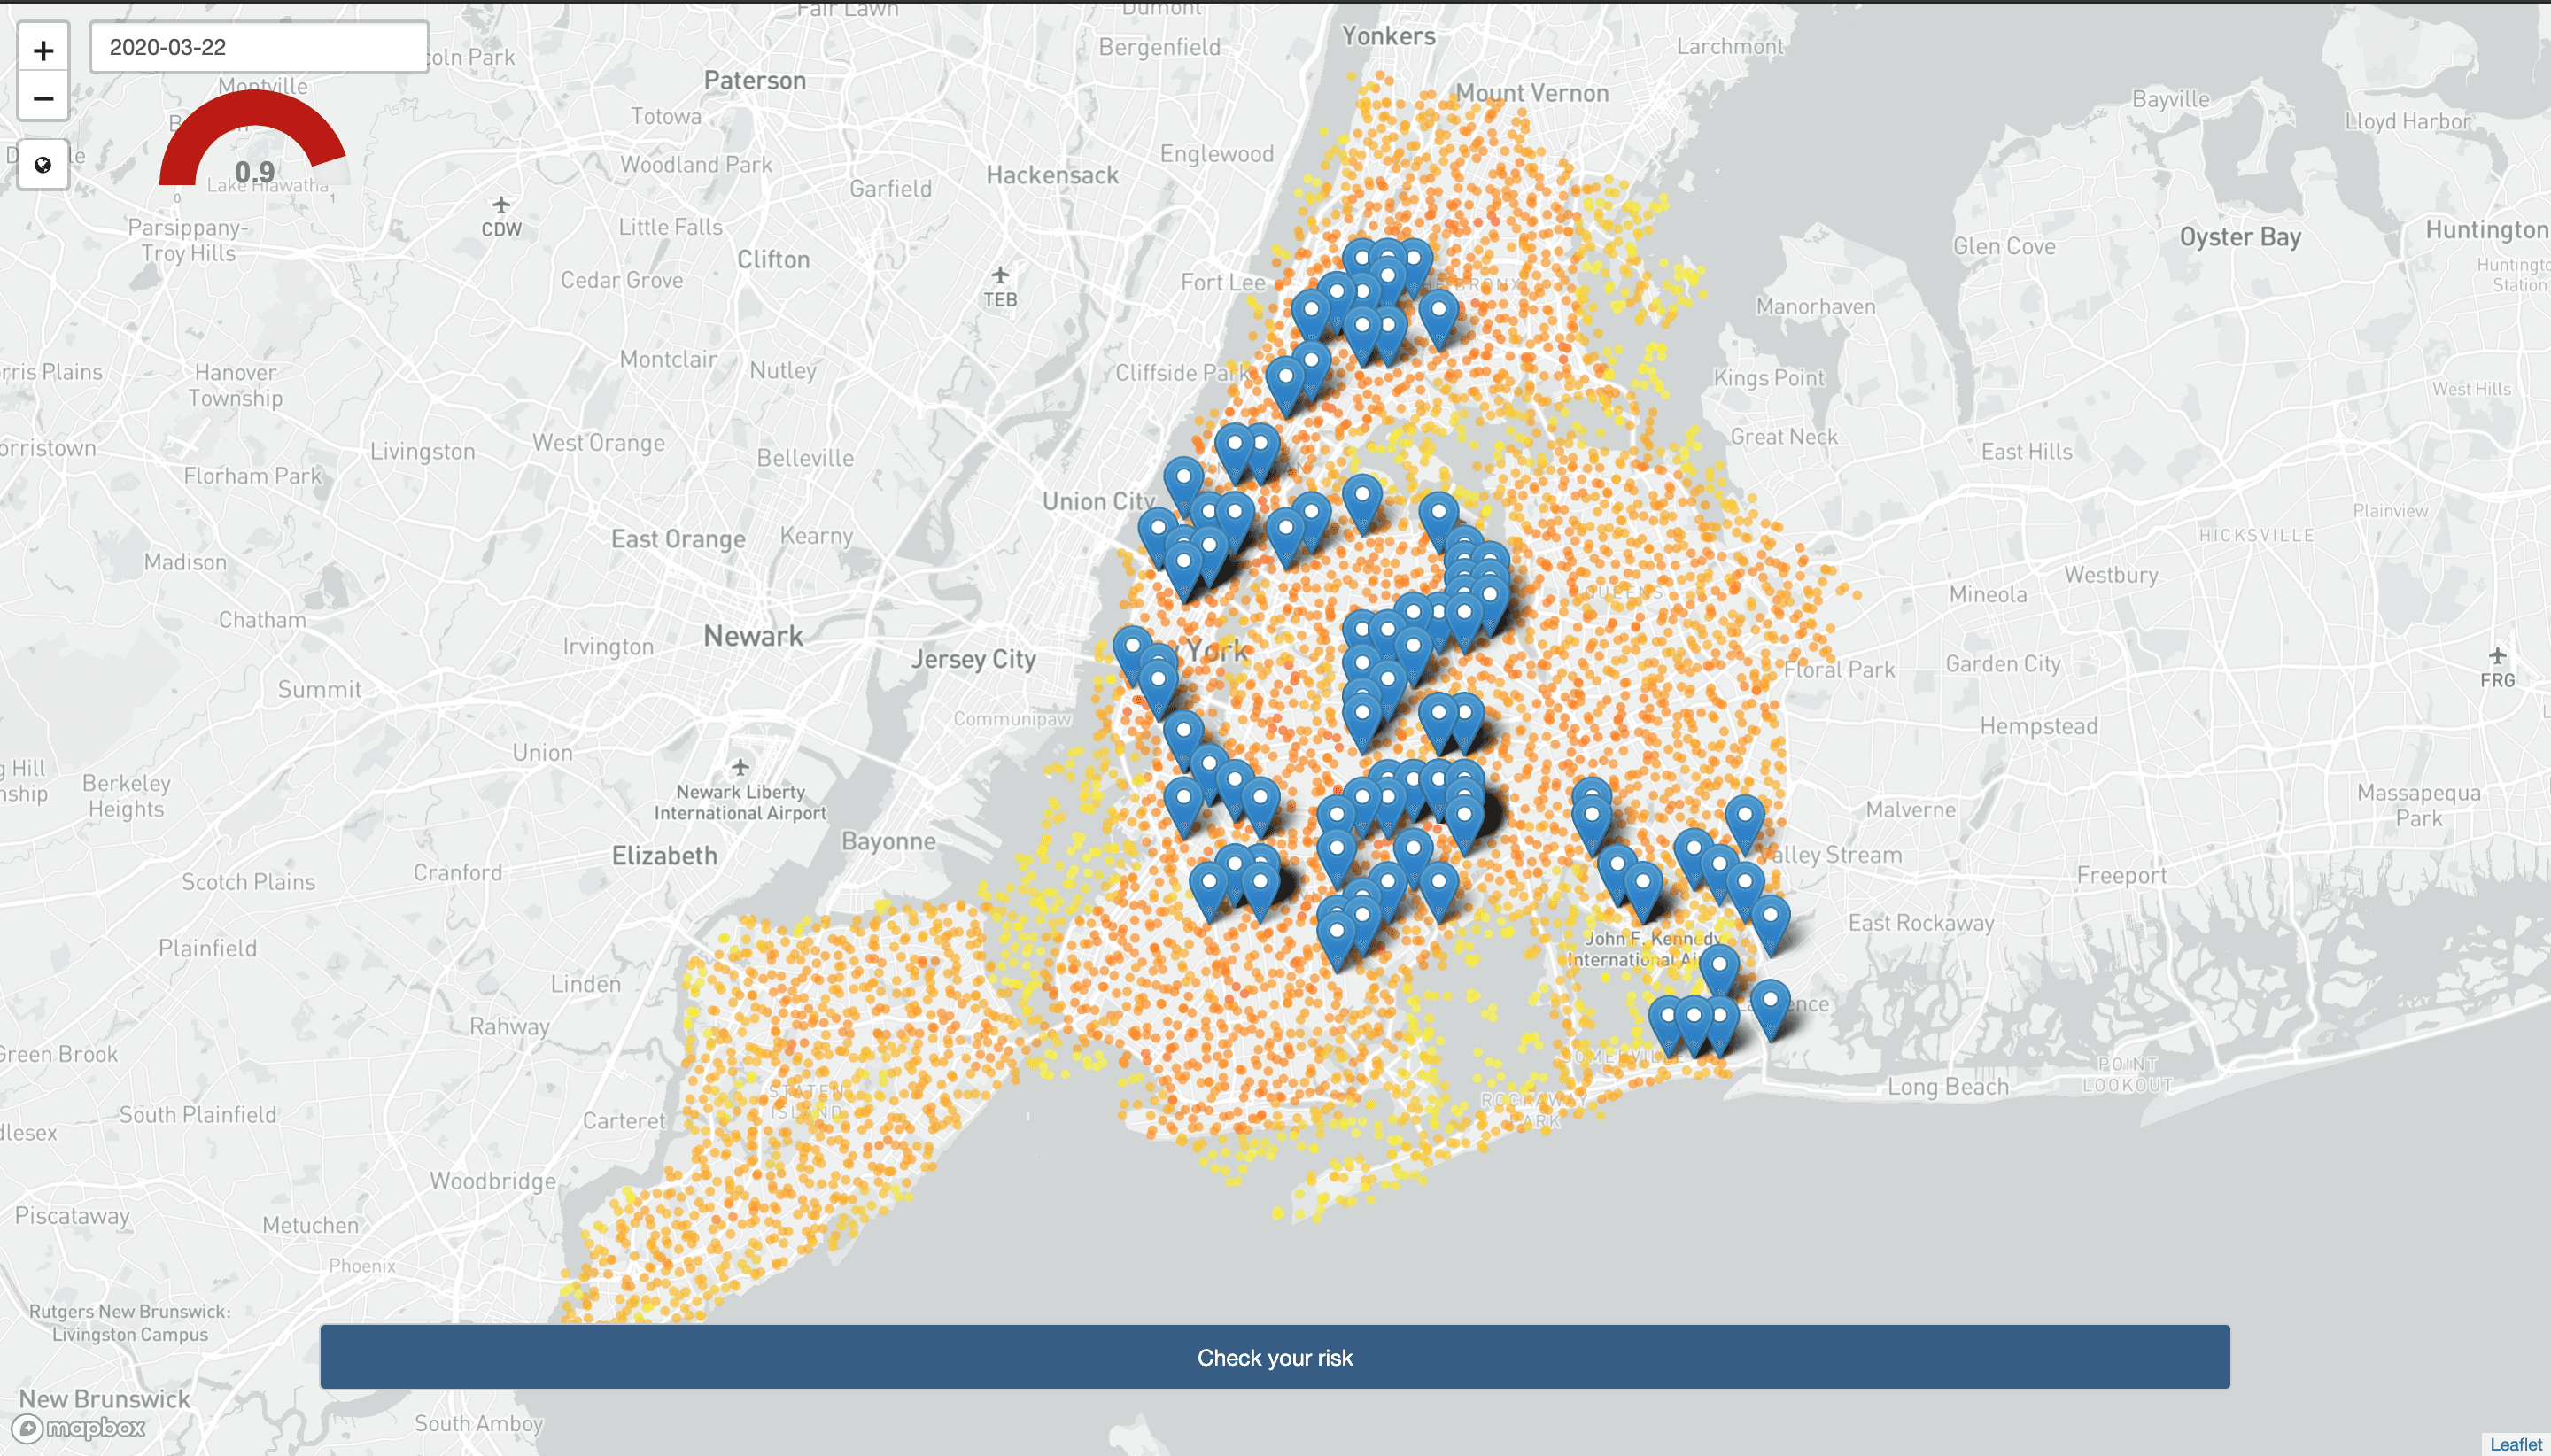
Data for Good: Fighting COVID-19 with Data Science
This is the first of two blog posts about our recent participation in the Pandemic Response Hackathon. Our project (CoronaRank) was one of only 5 projects out of 230 submissions chosen to present at the closing ceremony.
07 April 2020
Get Updates
Subscribe to Shiny Weekly Newsletter
Join 4000+ Shiny enthusiasts to see the latest Shiny news from the R community.


