Share
Share Tweet
Tweet Share
Share


3 Top Business Intelligence Tools Compared: Tableau, PowerBI, and Sisense

26 November 2020
Business Intelligence (BI) is used to transform data into actionable insights that provide value to an organization and help achieve its business goals. Reports and dashboards are the go-to approaches for modern-day business intelligence tools.
At Appsilon, we are big advocates of R and R Shiny, but we also have significant experience with business intelligence tools. Besides, coding custom solutions from scratch (or coding in general) isn’t always the right solution, especially for simple tasks. The custom-built BI solutions have their place, but more on that towards the end of the article.
Are you an Excel user who is curious about R Shiny? Read How to Switch from Excel to R Shiny: First Steps
All of the BI tools you’ll see in this article are top contenders in Gartner’s Magic Quadrant. Because of that, all of them are considered to be go-to solutions for enterprise businesses. Here’s a list of our top BI tools:
In addition to evaluating these tools, we’ll also answer the question of whether you should develop custom dashboards from scratch, and when would be an appropriate time for that.
Tableau
This BI tool doesn’t need an introduction. If you’re reading this article, you probably know what Tableau is and what it can do. It is considered one of the leading analytics platforms for good reasons – it is intuitive and easy to use and has remarkable visualization capabilities that look great by default.
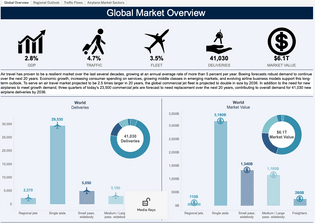
Tableau Showcase: Global Market Overview dashboard (https://www.tableau.com/learn/articles/business-intelligence-dashboards-examples)
Further, Tableau can connect to almost any data source you can imagine, handles larger datasets with ease, and has a great community behind it.
- Stuck on some visualization problem? A quick Google search will lead you to Tableau forums with an appropriate solution.
- Need to track your data on the go? Download the mobile app.
If this wasn’t the case, we seriously doubt that giants like Charles Schwab, PepsiCo, Verizon, and St. Mary’s Bank would use it on a daily basis.
The impressive features and ease of use don’t mean there aren’t any downsides to using Tableau. A lot of Tableau users complain about inadequate support. In many cases, all that the support team does is recommend that you buy another feature, promising that it will solve your issues. With Tableau, you are also limited in embedding features. If you have many visual elements, it becomes a real challenge to build a responsive dashboard. Further, we’ve found it almost impossible to build an external component that interacts with Tableau charts.
Next, let’s discuss pricing. Tableau offers a 14-day free trial, but once that’s over, the only viable option is to pay $840 for a year-long subscription. That comes to $70 per month, which is by no means cheap (and since we’re all stuck at home – we already have multiple streaming service subscriptions to pay for monthly). Scale this cost to a 10-person team, and that’s an expense you’ll notice ($8,400 per year!). More affordable options are available, but these are either limited in their capabilities or can’t be purchased for a single user.
For example, maybe some team members only want to look at charts and dashboards – so the Viewer license is enough for them. That will only set you back $12 per month instead of $70. If you want to use Tableau on the web only, the Explorer license is available. This will cost you $35 per user/month, but it requires you to purchase at least five licenses.
To conclude: Tableau is an excellent and easy-to-use BI tool, but it’s not cheap and has multiple potential deal-breaker limitations.
Read more about Tableau:
You can now create Tableau dashboard extensions using R and Shiny with RStudio’s shinytableau R package!
Microsoft PowerBI
PowerBI is a collection of software services, apps, and connectors that work together to turn unrelated sources into coherent, visually immersive, and interactive insights – at least according to Microsoft.
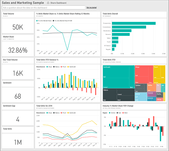
PowerBI Showcase: Sales and Marketing dashboard (https://docs.microsoft.com/en-us/power-bi/create-reports/sample-sales-and-marketing)
PowerBI is one of the most widely recognized BI tools due to its intuitive interface, various visualization options, and because it looks good by default. Even if something isn’t supported, PowerBI can easily connect to R and Python.
PowerBI comes in a few different flavors:
- PowerBI Desktop – a Windows-only application used to perform analysis, create visualizations and reports
- PowerBI Service (Pro) – web application used to create dashboards. Provides a way for sharing results through a collaboration mode
- PowerBI Mobile – a mobile application used only for data access, not for analysis. It is available for both Android and iOS
All of these options and plenty of other more technical details made PowerBI a tool of choice for giant corporations, such as Walmart, Apple, And ExxonMobil.
PowerBI is easy to get started with. You’ll only need a couple of crash courses to create impressive data visualizations. Don’t let this fool you though – PowerBI is tough to master, as this requires learning the whole suite of Microsoft tools. At the same time, that’s the biggest reason to use PowerBI – it includes full integration with the Microsoft ecosystem (authorization, Azure, Office 365, and so on). If you are a big fan of Microsoft’s UI, it’s safe to say you’ll find PowerBI somewhat familiar and comfortable.
As with Tableau, PowerBI isn’t all sunshine and rainbows. PowerBI is read-only, and you can’t access the source code. As a result, it is nearly impossible to maintain proper version control. This is a problem that PowerBI shares with Microsoft Excel.
Also, you can’t do too much about visuals within PowerBI. Don’t get us wrong, there is a lot you can tweak, but the amount of options doesn’t necessarily correlate with how charts end up looking. The UI can also feel overwhelming at first because there are too many icons and menus to look at, which takes focus away from the visualizations.
When it comes to pricing, things look better with PowerBI than with Tableau. PowerBI desktop is entirely free, provided you have a Windows machine. It is limited to approximately 2GB of data, but you can always upgrade to the Pro version if you need more. It will set you back $9.99 per month per user, so this shouldn’t be a deal-breaker. There are more advanced Premium versions of PowerBI which are used in enterprise situations, and those currently cost $4,995 per month per dedicated cloud compute and storage resource.
To conclude: PowerBI can be entirely free for individuals and small teams depending on the use case. The tool has its quirks, and it’s not as intuitive as Tableau, but it won’t cost you a small fortune to get started.
Read more:
Sisense
Sisense falls into the category of excellent but lesser-known business intelligence tools. It’s not that no one is using Sisense – quite the opposite – but it’s the lack of brand awareness that makes you think of Tableau or PowerBI first. Even so, we think Sisense gives PowerBI and Tableau a run for their money.
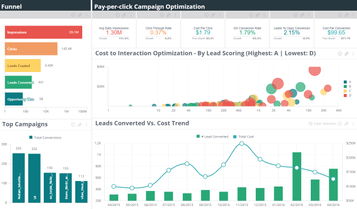
Sisense Showcase: Marketing dashboard (https://www.sisense.com/dashboard-examples/marketing/)
Sisense provides a drag and drop solution for analytics and dashboards, both on-premise and in the cloud. Dashboards and insights can be shared with multiple users, and they can even run their queries, depending on the set permission level.
Sisense has been placed in the Visionary quadrant of the Gartner Magic Quadrant for BI and Analytic platforms. That’s a huge accomplishment because the competition is harsh in this department. Further, Sisense is well-recognized and used by companies such as Hewlett Packard (HP), Phillips, Nasdaq, Motorola, and Wix.
Sisense is divided into two parts:
- Web interface
- ElastiCube – an analytical database that must be downloaded locally
In the ElastiCube, you can load and establish connections to the data. Keep in mind that it requires a Windows machine to function. If you are not on Windows, the cloud is the only option. Any form of analysis and visualization is done through the web interface. Sisense is known for its good performance on larger datasets and low-ish hardware requirements.
That all sounds great, but let’s consider the downsides. It has been reported many times that Sisense dashboards only work well on the web. The other big downside is that Sisense doesn’t support sending scheduled reports via email. Besides that, Sisense is a great BI tool that doesn’t lag behind its more well-known competitors.
With regards to the pricing, there’s not much we can tell you. They offer an annual licensing model tailored to individual business needs, but how much it actually costs for an arbitrary user is unknown.
Read more:
Should You Develop Dashboards From Scratch? Better Business Intelligence Tools
Answering this question isn’t easy. Honestly, the most correct answer is “it depends”, but this isn’t a sufficient answer. We’ll try to demystify this question as much as possible in this section.
Using a BI tool is sometimes enough. If you are analyzing and visualizing data for yourself, it doesn’t have to look amazing. The only important thing is that it gets the job done. This might also be the case for internal analysis and visualization projects in smaller companies.
But what if you are performing and delivering analysis for a client? Can you afford to make your reports look only somewhat decent instead of amazing/impressive? Probably not. That’s where custom-built web applications in the form of a data analytics dashboard come into play.
Most business intelligence tools fail whenever you try to integrate them within other web apps, and you are forced to use their products individually. Most of our clients want to embed dashboards within other tools keeping them fully controlled by external UI elements and with custom authorization setups. This BI limitation often results in having multiple BI tools within one organization rather than having access to a single integrated solution.
At Appsilon, we are big fans and avid users of R and R Shiny. These technologies have helped us create numerous dashboards for small, medium, large, and even Fortune 500 companies. If you want to leave a professional impression on your clients, developing an analytical solution from scratch isn’t just one of the options – it is the only option.
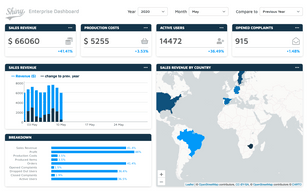
R Shiny Enterprise Demo Dashboard (source: https://demo.appsilon.ai/shiny-enterprise-demo/)
Our open-source team has developed R packages for UI, routing, and translations to make dashboard development from scratch easier. These packages allow you to deliver an impressive all-around solution in a fraction of the time.
Learn more:
Conclusion – top business intelligence tools
Covering all of the available business intelligence tools isn’t feasible for a single article. Instead, we wanted to cover a few of the top market leaders. Tableau, PowerBI, and Sisense have their place in modern data analytics and visualization, and it’s up to you to decide which one(s) you’ll use.
If price is your main concern, start with PowerBI. The free version comes with more than enough features for many users, but if you want something completely customizable, R Shiny and other code-based solutions are your only real options.
Learn more: Why You Should Use R Shiny for Enterprise Application Development
With Shiny, you can quickly get up to speed in a couple of weeks or even a couple of days, depending on your prior knowledge of programming. If you want to make a scalable enterprise Shiny dashboard, then you can always reach out to Appsilon for help. We’re continually pushing the limits of what’s possible with Shiny, and we’d be happy to guide you and your company.
Learn more about R and business intelligence tools
- How Our Project Leader Built Her First Shiny Dashboard with No R Experience
- A crash course in R Shiny UI
- How to translate R Shiny dashboards
- How to make R Shiny faster
- How to scale R Shiny dashboards
Appsilon is hiring! We are seeking R Shiny developers. See our Careers page for all new openings.
Contact Us
Project Manager

Get Updates
Subscribe to Shiny Weekly Newsletter
Join 4000+ Shiny enthusiasts to see the latest Shiny news from the R community.