

Machine Learning and Plankton: Copepod Prosome and Lipid Sac Segmentation


 Share
Share Tweet
Tweet Share
ShareThis project was done in collaboration with Dr. Emilia Trudnowska from the Department of Marine Ecology at the Institute of Oceanology Polish Academy of Sciences. Her work is primarily focused on Arctic zooplankton, its distribution, size spectra, and ecology. Appsilon’s previous work with plankton data, monitoring marine arctic ecosystems with machine learning, provided a strong platform to continue research in this area.
TOC:
Project Background: Arctic Copepods and Machine Learning
The fundamental idea behind the scientific project led by Dr. Trudnowska is to recognize the ecological plasticity of key Arctic copepods – Calanus on the basis of a few key morphological traits derived from photographs. The crucial part of this study is to learn more about the relationship between the size and volume of two components of planktonic organisms: the prosome (the main body) and the lipid sac (energy reserves accumulated by copepods before winter).
Shags, drones, and YOLO – The story of how Appsilon and the Polish Antarctic Station are assessing the Antarctic ecosystem.
Typically it takes a tremendous amount of time and human resources to manually compute these features across thousands of photos collected within the scope of several campaigns and research projects. A machine learning-based solution that can segment the Prosomes and Lipid sacs with sufficient accuracy could solve this problem by automating the area computation process. These areas could then be used to approximate the fitness of individuals, and thus their quality as a food source for higher trophic levels. Such a solution holds the potential to turn weeks of work into a matter of minutes!

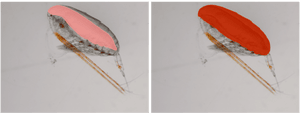
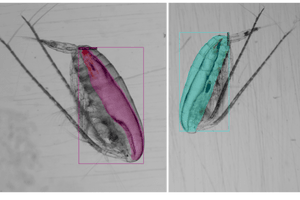
Lipid Sac (left-image; pink-part) & Prosome (right-image; red-part)
I find the results to be very promising. I know that in the last few years, several research groups started some attempts on automatisation of lipid sac analyses from such kinds of photos, but they were never as satisfactory as the model approach utilized by Appsilon. Such a tool will save a tremendous amount of time, not to mention the repeatability of automated methods, as each human (student) has slightly different eye perception and way of reasoning about the visible extent of specific elements. I am more than happy to apply this method for data analyses of the new article dealing with ecological plasticity of those important planktonic animals in order to understand their morphological response to variations in ocean hydrography (temperature) and food quality in the sea, which determines their quality as food for fish, seabirds and mammals in the region of Svalbard.
– Dr. Emilia Trudnowska, Institute of Oceanology Polish Academy of Sciences
Data: Machine Learning Approach to Copepod Lipid Sac Analysis
The dataset we used to validate the feasibility of the machine learning approach consisted of about 350 labeled, high-resolution, calibrated binocular images of Calanus with clearly visible prosomes and lipid sacs.

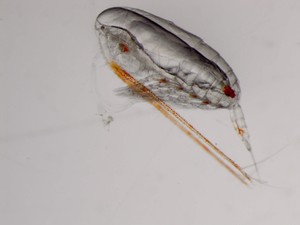
The prosomes and lipid sacs were labeled as n-edged polygons (the number of vertices, white dots, serves as a good indicator of how tedious the work of manually labeling the images is!).
Modeling – MaskRCNN
A popular region proposal network, MaskRCNN, was trained under the detectron2 framework to serve as a benchmark for more modern and fine-tuned approaches. Since one class was a spatial subset of the other, a significant number of pixels were double-labeled, something the MaskRCNN is not built to deal with. Hence, two separate instances of the model, with identical architecture and hyperparameters, were trained (one for each class).

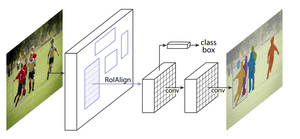
Image from He et al., 2017
150 of the images were used for training while the remaining 200 were reserved for validation and testing. Training each instance for 2000 iterations, with two workers and a batch size of two, took approximately 15 minutes using a K80 GPU (the same GPU available on a standard Colab runtime).
Results of Machine Learning to Identify Copepod Structures
Qualitative Results
For lipid sacs, 85% of the results appeared to fit into our visual quality criteria!

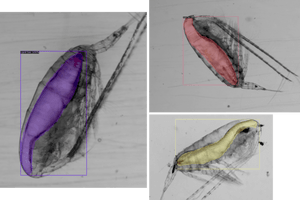
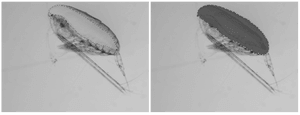
Sample results for lipid sac segmentation
For prosomes, a staggering 95% of the test results appeared to fit well!

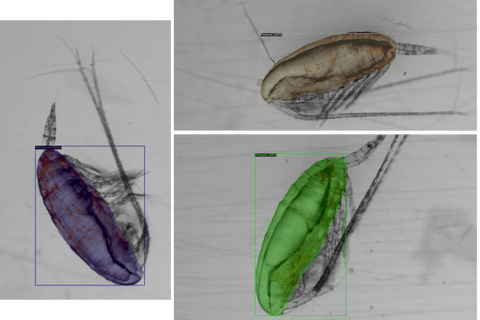
Sample results for prosome segmentation
Quantitative Results
The results were further evaluated using 2 different quantitative metrics: Intersection over Union (Jaccard Index) and F1-score (Dice coefficient). These metrics are typically used by practitioners of machine learning (and other statistical methods) to evaluate the performance of a given predictive solution.
Intersection over Union
This metric is computed by dividing the number of common pixels between the model’s prediction and the ground truth (intersection) by the total number of pixels occupied by either the model’s prediction or the ground truth (union).
This is a rather conservative metric in that it gets harder and harder to improve the scores as the results (area of intersection) improve.
For lipid sac segmentation, we were able to achieve a mean IoU of 86% whereas for prosome segmentation we were able to achieve a mean IoU of 94.4%! Those are very good scores, as typically an IoU as low as 50% is considered to be good.
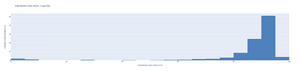
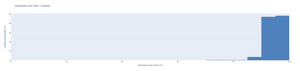
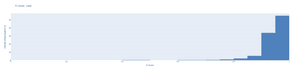
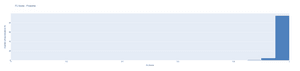
As shown by the histograms below, more than half of the results were above 90% for the lipid sac, whereas almost all (95%!) of the results showed an IoU greater than 90%. Even in the worst case, the results did not fall below 75% for prosome.

F1 Score
This metric is computed by dividing two times the number of common pixels between the model’s prediction and the ground truth (intersection) by the sum of the number of pixels covered by the model’s prediction and the ground truth (intersection + union).
This metric indicates the model’s balanced ability to both capture correct pixels (recall) and be accurate with the pixels it does capture (precision), thus making it more useful for our intended application, i.e., area computation.
For lipid sac segmentation, we were able to achieve a mean F1-score of 0.94 whereas for Prosome segmentation we were able to achieve a mean F1-score of 0.97! Those are exceptional scores as scores above 0.8 are typically considered to be good, and above 0.9 as very good.
As shown by the histograms below, more than half of the results for lipid sacs were over 0.95! For prosomes, more than 92% of the results were over 0.95 and 65% of the results were in the 0.97-1.00 range!
Areas of Improvement for Modeling Copepod Lipid Sacs and Prosomes
While most of the initial results look great, there were some cases of under-coverage. We’re currently working on improving those.
You can see such examples in the images below.
Copepods and Machine Learning – A Faster Approach to Structure Identification
Here we reported on a standard deep learning solution, often considered a benchmark model for image segmentation tasks. We produced promising results in the segmentation and area computation of two components, prosomes and lipid sacs, of the Calanus (Arctic Plankton) body.
Computer Vision and Flowers – A budding way to monitor shifting ecosystems.
This will help reduce the time taken to evaluate the fitness of a Calanus population, and thus its quality as a food source for higher trophic levels, from weeks to minutes! A paper utilizing the results is on its way! Stay tuned to our AI & Research page for future updates.
We’re working on fine-tuning the results, perhaps to an extent to supersede conventional methods. We also look forward to the possible impact our work can have when used on large datasets collected in various research groups around the world (in particular in Canada and Norway)!
Let’s Talk Copepods!
If you have a similar dataset or are interested in how our AI & Research team can assist in your project, let’s talk.
Contact Us

