

Visualizing Plankton Diversity and Climate Change: Impacting Policy with R Shiny


 Share
Share Tweet
Tweet Share
SharePlankton may be small, but they are mighty. These organisms play a crucial role in maintaining the health of our oceans. Their diversity and abundance make them a primary source of food for many marine animals. And they produce around half of the world’s oxygen!
Understanding how plankton reacts to changes in the ecosystem is important to evaluate its ability to serve as food for other animals and its role in regulating cycles of carbon in the ocean. Appsilon has already been contributing to the scientific community’s efforts to better understand the Arctic zooplankton by leveraging machine learning.
From our Data for Good program, we partnered with ETH Zürich (ETHZ) and International Union for Conservation of Nature (IUCN) to leverage the power of R Shiny. With our combined domains, we aim to bridge the gap between science and policy, in a quest to turn data into effective conservation.

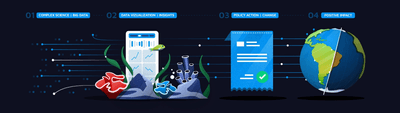
From Science to Impact: Using Interactive Dashboards to Visualize Plankton Diversity and Drive Policy Making
Evidence-Based Policy Change Through Interactive Data Visualizations
Oceans are in trouble, but understanding plankton can help us protect them. Global marine ecosystems face significant environmental challenges, from overfishing to climate change. These threats do not discriminate, affecting the largest whales as well as the tiniest marine creatures.
Plankton are highly sensitive to changes in their environment. On the one hand, this makes it a powerful indicator of the health of the marine ecosystem as a whole. But on the flip side, it also means as our oceans change, it is at risk. Human-induced environmental changes threaten all components of biodiversity, from the physiology of organisms to the biological communities that provide ecosystem services. Climate change is causing a decline in plankton diversity, which could have serious consequences for ocean ecosystems, such as a lack of food for all marine organisms.
Plankton provides a wealth of information for bioprospecting endeavors, as it harbors genes useful for human industries. Despite the importance of global plankton diversity, it is notably absent from climate discussions and policies.
To better understand the current state of the marine ecosystem and the potential impact of climate change on plankton diversity, we turned to what we are best at – creating an interactive dashboard using R Shiny. This web-based tool allows policymakers and researchers to visualize a large dataset showing information on the marine ecosystem’s current state and projected future plankton diversity changes in different climate scenarios.

Plankton: The Superstars of the Ocean
Plankton are critical to the health of the world’s oceans serving as a quality food source for other animals, acting as bioindicators, reflecting changes in the marine environment and ecosystem, and much more.
While scientists have long suspected that this decline could harm ocean function, we don’t have a clear picture of how bad the situation could get. This lack of data makes it difficult for policymakers to make informed decisions about how to protect these important organisms. Without a better understanding of the vulnerability of plankton diversity, we risk losing an essential part of our planet’s delicate balance.
As such, plankton are increasingly being recognized as important for global marine biodiversity monitoring efforts.
Monitoring Marine Ecosystems with ML – A budding way to monitor shifting ecosystems.
Shaping Policy and Effective Conservation with R Shiny
As part of our Data4Good (D4G) initiative, we worked together with ETH Zürich (ETHZ) and International Union for Conservation of Nature (IUCN) to build a data visualization application showing information on the marine ecosystem’s current state and projected future plankton diversity changes in different climate scenarios. Such information is vital for preserving ocean health and creating effective and impactful laws on the international policy level.
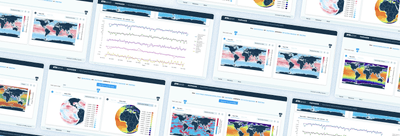
The scientific studies done prior to building the visualization dashboard involved mapping the biogeography of 859 plankton species using observational data and novel machine-learning algorithms. Our partners defined ocean biomes, projected future changes in biodiversity, and identified hotspots of diversity change. Equipped with these data we built an interactive dashboard that visualizes the results on a global map, making it easy to see patterns and trends over time.
MAPMAKER – A Shiny Tool for Biodiversity
What makes our tool unique is that it is the first global plankton diversity and biogeography visualization as a function of time and emission scenario. This means that policymakers can use the tool to see how changes in emissions might impact the marine ecosystem in different parts of the world.

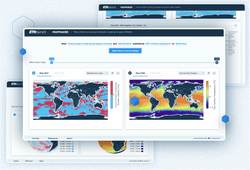
Mapmaker Shiny dashboard mockup
Interested in learning more about plankton diversity and climate change, and what the data visualization looks like? Explore the dashboard for yourself.
Interactive Shiny Dashboards: Bridging the Knowledge Gap
One of the challenges of scientific research is translating it into meaningful policy changes. Often, policymakers lack quantitative evidence on the vulnerability of marine ecosystems, which makes it difficult to create effective and impactful laws on the international policy level.
The interactive dashboard helps to bridge that gap by providing policymakers with the data they need to make informed decisions about marine management. For example, policymakers can use the tool to identify areas of the ocean that are particularly vulnerable to changes in plankton diversity, and then target their conservation efforts accordingly. The tool can also help policymakers shape future policies and decision-making on what management tools and measures to use and where with maximum effectiveness.
To protect plankton diversity and its associated ecosystem services, decision-makers must have adequate information to plan and implement solutions at both global and local levels. Currently, future projections of marine plankton diversity changes remain uncertain, primarily due to the shortage and biased nature of global observational data. Developing new tools to visualize plankton diversity and ecosystem changes – like the MAPMAKER – offers a remedy to that.
More on Data4Good
Interested in using technology for positive impact? Get more information in your LinkedIn feed by signing up for the Data4Good Newsletter.
Contact Us
