


 Share
Share Tweet
Tweet Share
Share


The Biotech and Pharmaceutical industries face a need for faster results and analysis of large datasets, which places tools and languages that handle such data and communicate results faster in high demand. This is where Shiny, an R package for interactive web applications, enters the scene.
In this blog post, we’ll explore some unique, specific, and well-designed examples of Shiny being used to streamline data analysis and visualization, and solve complex problems. The Shiny app examples range from proteomics to drug discovery to federal regulatory submissions.
With an ever-growing list of use cases, it’s increasingly apparent that R and Shiny have found a foothold in the Life Sciences.
TOC:
- Proteomics Data Analysis
- Clinical Trial Data Exploration
- Drug Discovery and Interactions
- FDA and Regulatory Submission
Why Use R and Shiny in Pharma, Biotech, or Other Interdisciplinary Health Fields?
Efficient data analysis and visualization
R is a powerful statistical programming language that is particularly well-suited to handling large and complex datasets. It provides a wide range of tools in a healthy open-source ecosystem for data manipulation, exploration, and visualization. While R is considered challenging to master, R packages make it easier for beginners and experts alike, contributing to its widespread adoption. Ultimately, R and its packages allow researchers and analysts to quickly identify patterns, trends, and insights.
Customizable web-based applications
Shiny, an R package, allows users to easily create customizable web-based applications that suit specific research needs. Shiny applications can include interactive visualizations, data input forms, and other user-friendly features, allowing researchers to quickly and easily share their results with others.
Additionally, there is a healthy and growing ecosystem of Shiny-related packages to support developers (and non-developers). And an increasing number of consultants, Shiny developers, enterprise products, and integrations.
Compliance and regulatory requirements
In Pharma and Biotech, consumer safety and product reliability are strictly regulated. Shiny can be used from project planning and manufacturing to clinical trials and reporting, but how what R programming programmatic solutions are avaible to meet GxP (Good x Practices)?
There’s a growing number of open source R tools making it easier to comply with GxP, such as the ability to generate reproducible reports that meet regulatory standards and automate data quality reporting.
Below, we will see one such example of both R and Shiny being submitted to the United States Food and Drug Administration (FDA).
Examples of R Shiny in the Pharmaceutical and Biotech Industries
Shiny and Proteomics Data Analysis
{Bigomics}
Omics Playground is a self-service analytics platform for the exploration, visualization, and analysis of Big Omics Data in the Biotech and Pharma spaces. It is designed to allow biologists to apply a wide range of analysis tools to their own data without coding. The platform is implemented using the R/Shiny web application framework and can be run either from source code or by downloading the Docker image.
It consists of two main components, one for data importing and preprocessing, and the other for real-time visualization and interaction with users. The online interface is subdivided into Basic and Expert modes to provide a customizable experience suited to each user’s background. The platform comes with some example datasets, but users can analyze their data by using the upload function or creating/modifying scripts in the “scripts/” folder. More detailed information and feature explanations can be found in the online documentation.
{ProViz}
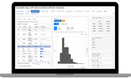
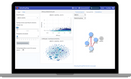
ProViz is a data visualization and analysis tool developed at SomaLogic. It imports ADAT files and enables users to perform various exploratory data analytic processes such as merging additional sample data, filtering, creating groups of data, and creating interactive boxplots, CDFs, and scatter plots. It also allows users to perform basic statistical tests such as t-test, U-test, and KS-tests.
ProViz is distributed under the MIT License, and the ProViz User’s Guide provides detailed information about the tool.
Shiny and Clinical Trial Data Exploration
{Teal}
Teal is a Shiny-based interactive exploration framework for analyzing data. This R package requires app developers to specify the type of data to be analyzed, which can be CDISC data, independent datasets, related datasets, or multi-omics experiments. Teal modules are Shiny modules built within the framework that specifies the analysis to be performed. Some modules are provided in the teal.modules.general, teal.modules.clinical, and teal.modules.hermes packages. Teal functionality also comes from other packages, including teal.data, teal.widgets, teal.slice, teal.code, teal.transform, teal.logger, and teal.reporter.
The package provides examples of teal apps in the teal gallery and TLG Catalog. To install the package, it is recommended to create and use a Github PAT and run the provided code.
Shiny Drug Discovery and Drug Interactions
{Drug Interactions}
Appsilon’s Drug Interaction dashboard allows users to find interactions between two existing drugs or active compounds from the US National Library of Medicine (NLM) database. The Shiny dashboard facilitates access to information by eliminating the complexity of searching through multiple databases and filtering relevant data.
The tool was built using Rhino for a high-quality, enterprise-grade Shiny application, and APIs like RxNorm, Drug Interaction, and PubChem were used to retrieve information about drug interactions, drug descriptions, and related drugs.
The tool has a responsive design that adapts to both desktop and mobile screens, providing users with the flexibility to access its features virtually anywhere. The tool also provides a preview of drug interactions so users can quickly identify potential adverse effects.
{shinyDepMap}
A web tool to explore the Cancer Dependency Map (DepMap) project data. It has many useful applications, such as predicting how effective and selective future drugs with a known target gene will be, identifying targets of highly selective drugs, finding the most sensitive cell lines for testing a drug, navigating from an undruggable protein with a desired selectivity profile to more druggable targets with similar profiles, and identifying novel pathways necessary for cancer cell growth and survival.
R and Shiny in Regulatory Action – FDA Submission
{FDA-app} – The First of Its Kind
This Shiny application was submitted to the FDA as part of a pilot project to test the feasibility of submitting a Shiny app, bundled into a submission package to the FDA. In December 2022, it was successfully submitted; the first of its kind.
The project is an ongoing FDA-industry collaboration through the non-profit organization R Consortium, and all data, code, material, and communications from this pilot were shared publicly. The R Consortium hoped to establish a working example to guide the industry for the future submission of Shiny applications created with the R language.
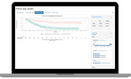
The application includes a Demographic Table, KM-Plot for TTDE, Primary Table, and Efficacy Table. The purpose of the application is to showcase the potential of Shiny apps in streamlining the submission process and improving the communication of clinical trial results. As the first Shiny app to be submitted to the FDA, its successful acceptance is a significant milestone in the use of innovative R and Shiny technology in the regulatory process and opens the door to future submissions.
Empowering Data Analysis and Collaboration in Pharma and Biotech with R Shiny Examples
The examples we explored in this blog post are by no means exhaustive. These are only a glimpse into R and Shiny in the Pharmaceutical and Biotech industries and a demonstration of the versatility and potential of Shiny in those spaces. The growing importance of faster results, safer outcomes, and more efficient analyses of large datasets and complex problems has led to a demand for tools that can handle such processes and communicate results better.
R and Shiny have proven to be powerful tools in this regard, enabling researchers and analysts to streamline data analysis, visualization, and collaboration, while also meeting regulatory compliance requirements. As the number of use cases continues to grow and the ecosystem of packages and consultants expands, it’s clear that R and Shiny have found a valuable place in the Health Sciences.
Not all Shiny applications are public facing; to discover what can be done behind the scenes with powerful data analysis and exploration let’s talk.
Contact Us
Project Manager

Get Updates
Subscribe to Shiny Weekly Newsletter
Join 4000+ Shiny enthusiasts to see the latest Shiny news from the R community.
Also on biotech
