

 Share
Share Tweet
Tweet Share
Share
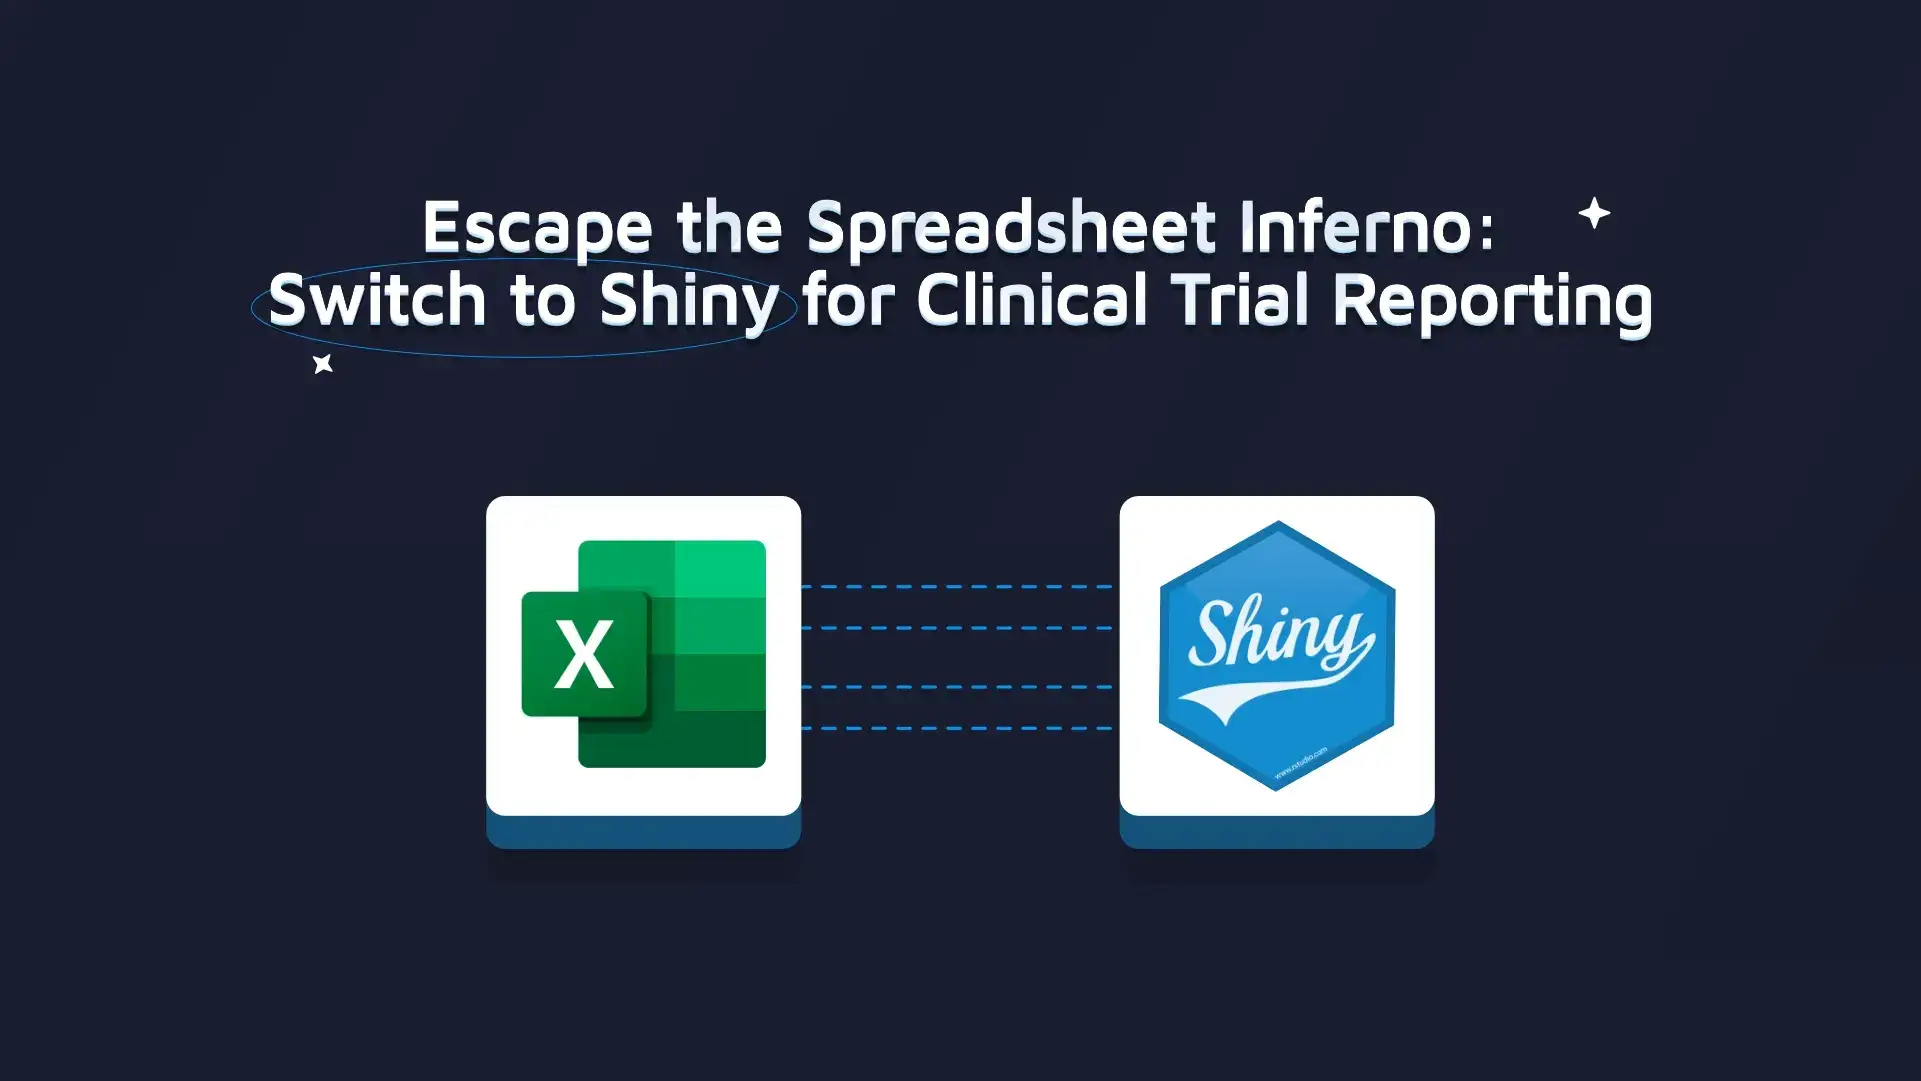
Escape the Spreadsheet Inferno: Switch to Shiny for Clinical Trial Reporting

28 February 2024
Data management in the pharmaceutical industry presents unique challenges, often compounded by the sheer volume and complexity of clinical trial data. Traditional methods, particularly spreadsheet-based approaches, have long been the norm, yet they pose significant drawbacks.
Interested in advancing clinical research with dynamic reports? Uncover how Shiny and Quarto can transform your data storytelling.
These methods are synonymous with inefficiencies, prone to errors, and can jeopardize data integrity.
In this article, we delve into the shortcomings of spreadsheets and explore the transformative potential of adopting Shiny Dashboards—a modern, dynamic solution designed to alleviate these challenges and elevate clinical trial data management to new heights of efficiency and reliability.
Table of Contents
- The Problem with Spreadsheets
- Shiny Dashboards: A Superior Alternative
- Seamless Migration from Spreadsheets to Shiny
- Simplifying the Transition to Shiny Dashboards
- Business Impact of Shiny Dashboards in Clinical Trials
- Summing Up Escape the Spreadsheet Inferno
The Problem with Spreadsheets
Clinical trial reporting involves handling numerous files and complex data sets. Spreadsheets, while familiar, are not optimal for managing such extensive data due to limitations in scalability, data integration, and real-time analysis.
Let’s discuss this a bit further:
- Data Fragmentation: Clinical trials generate vast amounts of data spread across multiple spreadsheets, leading to fragmentation and difficulty in consolidating information cohesively.
- Scalability Issues: As clinical trials progress, the volume and complexity of data increase exponentially, overwhelming the capacity of spreadsheets to handle large datasets efficiently.
- Lack of Real-time Analysis: Spreadsheets offer limited capabilities for real-time analysis and reporting, impeding timely decision-making and hindering the ability to respond promptly to evolving trial requirements.
- Security Concerns: Spreadsheets lack robust security features, leaving sensitive clinical trial data vulnerable to unauthorized access, breaches, and data loss incidents.
- Version Control Challenges: Managing multiple versions of spreadsheets poses version control challenges, increasing the risk of discrepancies and data inconsistencies over time.
- Risk of Errors: Manual data entry and manipulation in spreadsheets are prone to errors, jeopardizing data integrity and potentially impacting trial outcomes and regulatory compliance.
Shiny Dashboards: A Superior Alternative
Shiny, an R-based application, provides a dynamic platform for creating interactive web applications. It allows for effective data visualization and manipulation, making it ideal for clinical trial data management.
Seeking a powerful alternative to Excel? Unveil the potential of R Shiny packages to enhance your data insights.
Seamless Migration from Spreadsheets to Shiny
Migrating to Shiny from spreadsheets is a process that involves several considerations, including:
- Data Security: Shiny allows sensitive data to be managed server-side, with robust access control mechanisms. Posit, for instance, offers layers of security for data management.
- Infrastructure Requirements: A reliable hosting environment is necessary, whether self-hosted or using secure cloud services such as Amazon Web Services.
- Scalability: Shiny can integrate with scalable data solutions like data lakes, MySQL, AWS, and data warehouses. This ensures efficient management of large volumes of clinical trial data.
- Performance Optimization: Shiny apps should be designed to minimize the load on both the server and client sides. Efficient database querying techniques and selective data loading can significantly enhance performance.
- User-Friendliness: Ensuring that the Shiny dashboard is accessible to users without R programming knowledge is key. This involves intuitive design and clear data presentation.
- Testing: It’s important to thoroughly test your Shiny app to ensure it behaves as expected. This could involve unit, end-to-end, performance tests, and others.
Transitioning from Excel to R Shiny? Kick off your journey with our primer, How to Switch from Excel to R Shiny: First Steps.
Simplifying the Transition to Shiny Dashboards
Moving from traditional spreadsheet-based methods to Shiny Dashboards requires careful planning and execution. Here’s a step-by-step guide to streamline the transition process while addressing potential challenges:
- Assessment of Current Data Infrastructure: Begin by assessing your current data infrastructure and understanding the scope of data migration. Identify key stakeholders and departments involved in data management to ensure comprehensive planning.
- Data Quality and Validation: Implement rigorous data validation processes using tools like data.validator to maintain data integrity throughout the transition. Ensure that data is cleaned, standardized, and validated before migration to Shiny Dashboards.
- Version Control: Utilize tools like renv for package management to ensure the stability and compatibility of the Shiny Dashboards application over time. Implement version control practices to track changes, manage updates, and facilitate collaboration among team members.
- Mapping Data to Shiny Dashboard Components: Analyze your data requirements and map them to corresponding components in Shiny Dashboards. Determine the visualizations, filters, and interactive elements needed to represent your data effectively. It would be great to have a UI design at this point, in the form of a mock-up/prototype created using tools like Figma, Sketch, etc.
- Building Prototypes and Gathering Feedback: Develop prototype dashboards using Shiny and present them to key stakeholders for feedback. Incorporate their suggestions and iterate on the design until it meets the requirements and expectations of end-users.
- Regulatory Compliance: Design Shiny Dashboards to meet regulatory standards such as FDA submissions, ensuring compliance in the pharmaceutical sector. Implement features such as robust access controls, audit trails, and data validation mechanisms to maintain compliance throughout the transition process.
- Training and Capacity Building: Provide comprehensive training sessions for teams involved in data management and analysis. Offer resources such as online tutorials, documentation, and workshops to familiarize them with Shiny’s functionalities and best practices.
- Gradual Rollout and Testing: Roll out Shiny Dashboards gradually, starting with pilot projects or specific departments. Monitor the performance and usability of the dashboards, collect feedback from users, and address any issues or concerns that arise.
- Integration with Existing Systems: Ensure seamless integration of Shiny Dashboards with existing data systems and workflows. Utilize tools like RStudio/Posit Connect or Shiny Server to deploy dashboards securely within your organization’s infrastructure.
- Continuous Improvement: Establish mechanisms for ongoing maintenance and improvement of Shiny Dashboards. Regularly review user feedback, monitor performance metrics, and incorporate updates or enhancements to optimize the dashboards over time.
By following these steps and leveraging tools and strategies for data quality, version control, regulatory compliance, and team training, organizations can simplify the transition to Shiny Dashboards and maximize the benefits of modern data management techniques.
Explore validation essentials for Shiny Apps in regulatory submissions. Our post simplifies compliance in healthcare and pharmaceuticals.
Business Impact of Shiny Dashboards in Clinical Trials
Implementing Shiny Dashboards for clinical trial data management goes beyond mere technological upgrades—it directly influences the bottom line and overall business performance.
By streamlining data handling processes, organizations can make faster, more informed decisions, driving efficiency and competitiveness in the market.
- Improved Decision-Making: Efficient data management facilitated by Shiny Dashboards equips stakeholders with real-time insights into clinical trial progress, patient outcomes, and potential risks. This timely access to critical information enables agile decision-making, allowing teams to adapt strategies, allocate resources effectively, and mitigate risks promptly. As a result, businesses can optimize trial protocols, identify promising candidates for further study, and accelerate drug development timelines.
- Regulatory Compliance: Adherence to stringent regulatory standards is paramount in the highly regulated pharmaceutical industry. Shiny Dashboards offer features such as robust access controls, audit trails, and data validation mechanisms, ensuring compliance with regulations such as those mandated by the FDA. By maintaining data integrity and traceability, organizations can navigate regulatory hurdles seamlessly, avoiding costly delays and penalties associated with non-compliance. Learn more about R-based submissions to the FDA in our blog post.
- Enhanced Operational Efficiency: The transition to Shiny Dashboards streamlines data workflows, reducing manual intervention and minimizing the risk of human errors. This operational efficiency not only saves time but also optimizes resource utilization, allowing teams to focus on core activities such as research, analysis, and innovation. Consequently, businesses can achieve higher productivity levels and accelerate the pace of clinical trials, translating into faster time-to-market for new drugs.
- Cost Savings: While initial setup incurs costs, the long-term efficiencies gained from Shiny Dashboards lead to significant savings in data management. By reducing manual labor, preventing errors, and improving resource allocation, organizations lower operational expenses and enhance overall profitability. Additionally, streamlined processes facilitate faster decision-making and trial completion, further reducing costs associated with prolonged development timelines.
- Enhanced Visualization: Access to a wide range of visualization options makes data analysis more insightful and accessible. Shiny Dashboards empower users to explore data visually, uncovering trends, patterns, and insights that might otherwise remain hidden. This enhanced visualization capability facilitates clearer communication of findings and facilitates more informed decision-making across all levels of the organization.
- Streamlined ETL Process: The Extract, Transform, Load (ETL) process is an essential component in Shiny applications. This involves extracting relevant data, transforming it into a suitable format, and loading it into the application. Tools like dplyr, tidyr, purrr from tidyverse, DBI package are instrumental in this process, ensuring data is managed efficiently and is scalable.
Summing Up Escape the Spreadsheet Inferno
Switching from traditional spreadsheets to Shiny Dashboards can revolutionize clinical trial data management. With its scalability, security, and user-friendly interface, Shiny offers a powerful tool for efficient, accurate, and compliant data handling in the pharmaceutical industry.
Did you find this helpful? Contact us today to explore how your spreadsheets can evolve into dynamic Shiny applications.
Ready to take your R/Shiny skills for Life Sciences to the next level? Download our free eBook and begin your journey today.

Contact Us

Head of Sales

Get Updates
Subscribe to Shiny Weekly Newsletter
Join 4000+ Shiny enthusiasts to see the latest Shiny news from the R community.
Also on clinical reports
