Share
Share Tweet
Tweet Share
Share
Freshwater Dashboard – Importance of UI/UX for R Shiny Applications

26 September 2023
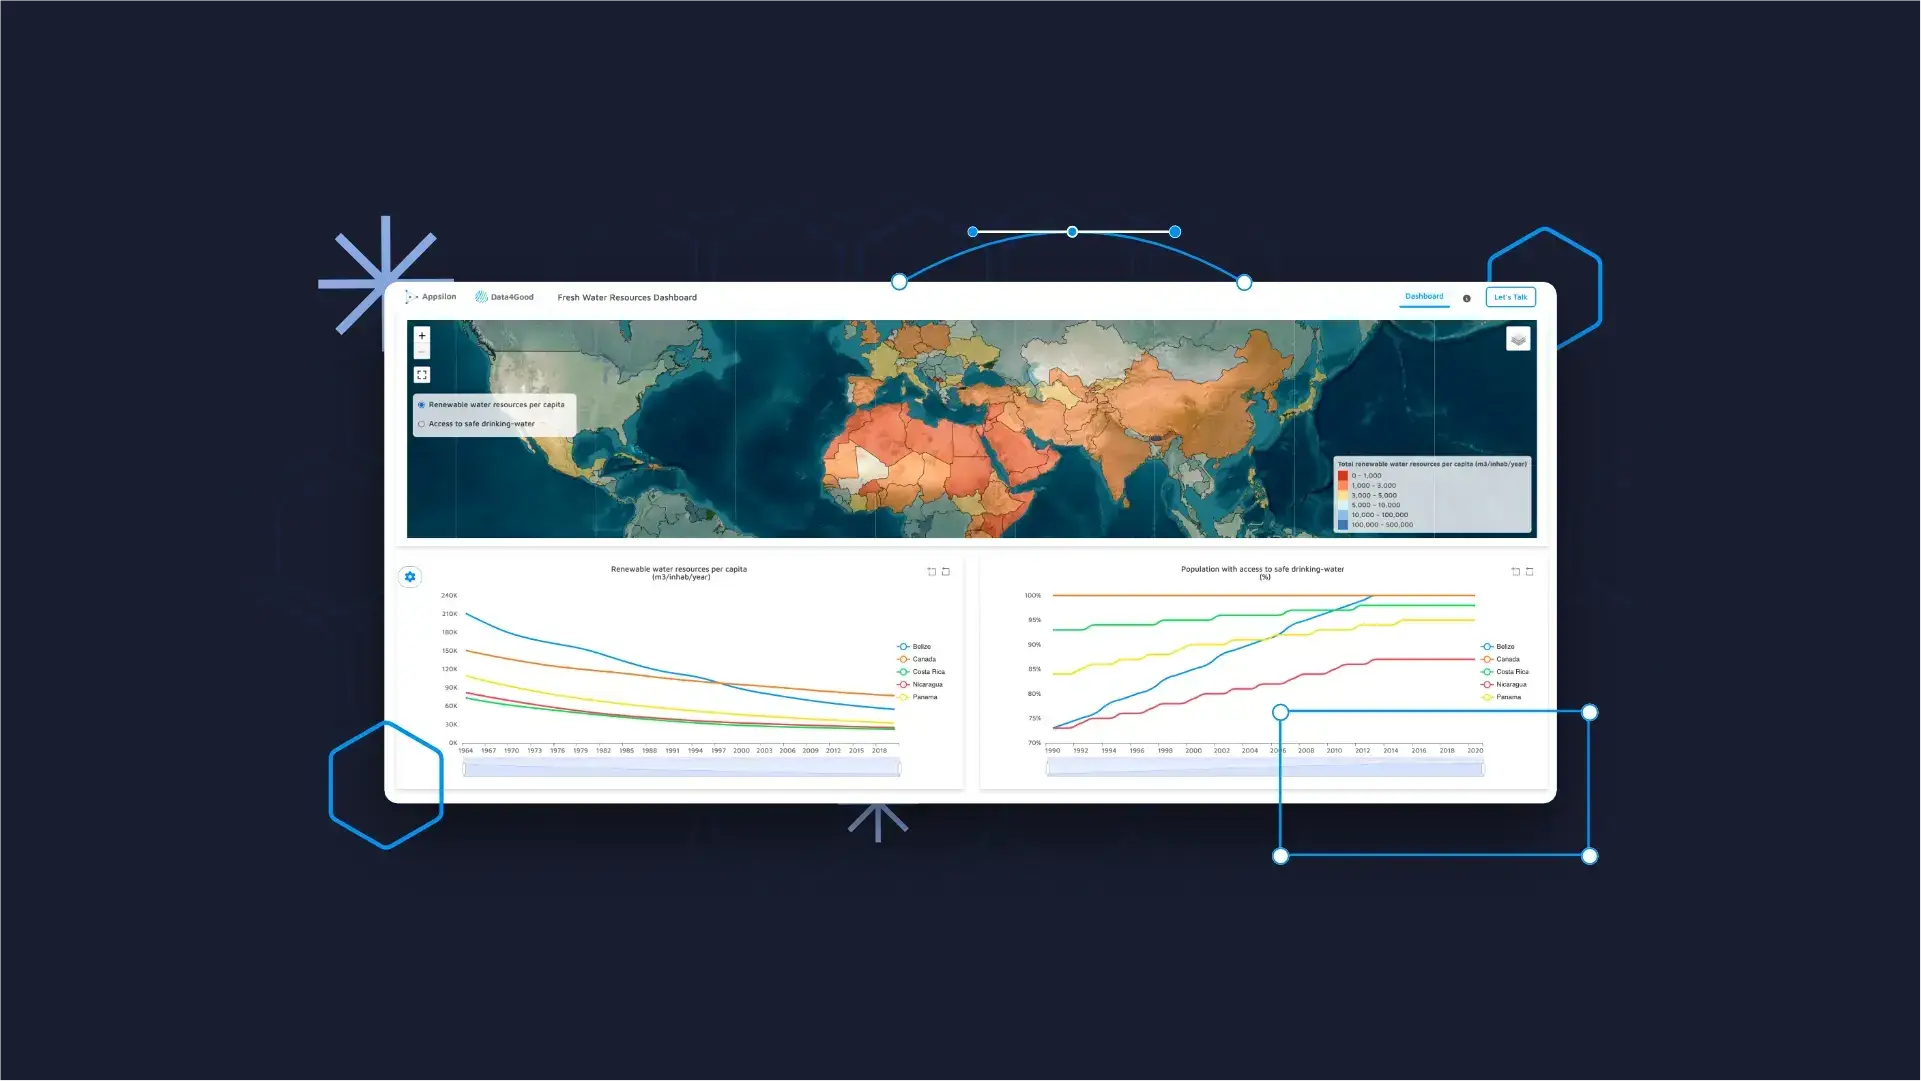
In today’s world, where freshwater 💧 scarcity is a pressing issue, having a comprehensive understanding of freshwater availability and access is important for making informed decisions and planning sustainable water usage. To address this need, the team at Appsilon has developed a powerful R Shiny dashboard under our Data4Good initiative, using Rhino as a backbone. This dashboard incorporates intuitive UI and UX elements to empower users and enable them to effortlessly explore freshwater data 📊.
By leveraging the AQUASTAT Database and several cutting-edge packages built in-house and by the community, such as imola, echarts4r, leaflet, and shinyWidgets, this dashboard offers a simple yet value-added design. It provides a global view of freshwater availability indicators, thereby aiding end users in making informed decisions and planning for a better future.
User Interface (UI) Design for Shiny Applications
Layout
The dashboard maintains a simple and to-the-point structure, dividing the layout into two parts:
- Navbar: We chose to use a navbar instead of a sidebar approach to maximize horizontal space for the dashboard’s body. The navbar facilitates easy identification of important elements for the user. By placing static elements such as the logo and title on the left, and interactive elements like the tab name, info button, and contact button on the right, a clear separation is created, resulting in a clean and minimalistic appearance.
- Body: This is where the magic happens. Body is tab-name specific. For the sake of simplicity & relevance, the dashboard is single pager and has 2 charts and 1 map along with filters to control them. Each component (chart/map) is wrapped in a card, enhancing the visual separation from the background. More details on this are provided below.
Info Button – About Section
The navigation bar includes an info button that serves as an “About” section for enhanced user understanding. When the user clicks the button, it triggers a comprehensive information display about the dashboard. The provided details encompass the dataset used, the technologies utilized, and the purpose of the dashboard. This feature empowers users and helps them navigate the dashboard effectively.
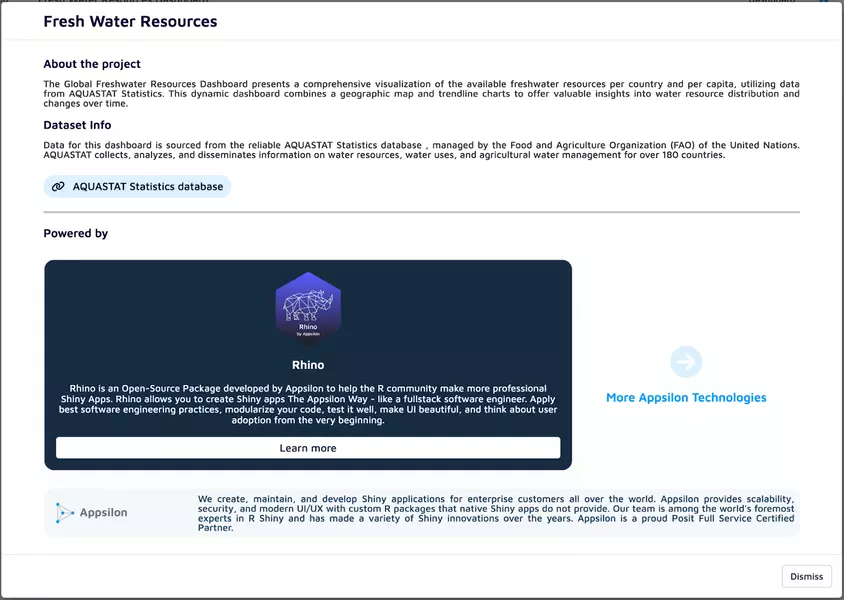
This has been achieved with shiny::showModal() and shiny::modalDialog(), content is completely custom made using personalized div and css.
Collapsible Filters – Continent & Country
To optimize the screen space available, we implemented collapsible filters using shinyWidgets::dropdown(). By clicking on the ‘gear’ button, users can expand the continent and country filters, simplifying the process of selection and filtering. The collapsible design ensures a clutter-free and organized layout, keeping users focused on the relevant data and charts.
For filters, we utilized shinyWidgets::pickerInput(), which offers a wide range of options such as limiting the max selection, live search functionality, and the ability to set window size.
The gear button is draggable, users can position it anywhere on screen. This feature was achieved using shiny::absolutePanel().
Users can select one continent at a time, and by default, the top five countries based on per capita water availability indicators are pre-selected. This thoughtful default selection ensures a clean and informative trend chart display. Additionally, users can manually select up to eight countries, providing flexibility while still maintaining a manageable visualization.
Interactive Trend Charts in Shiny
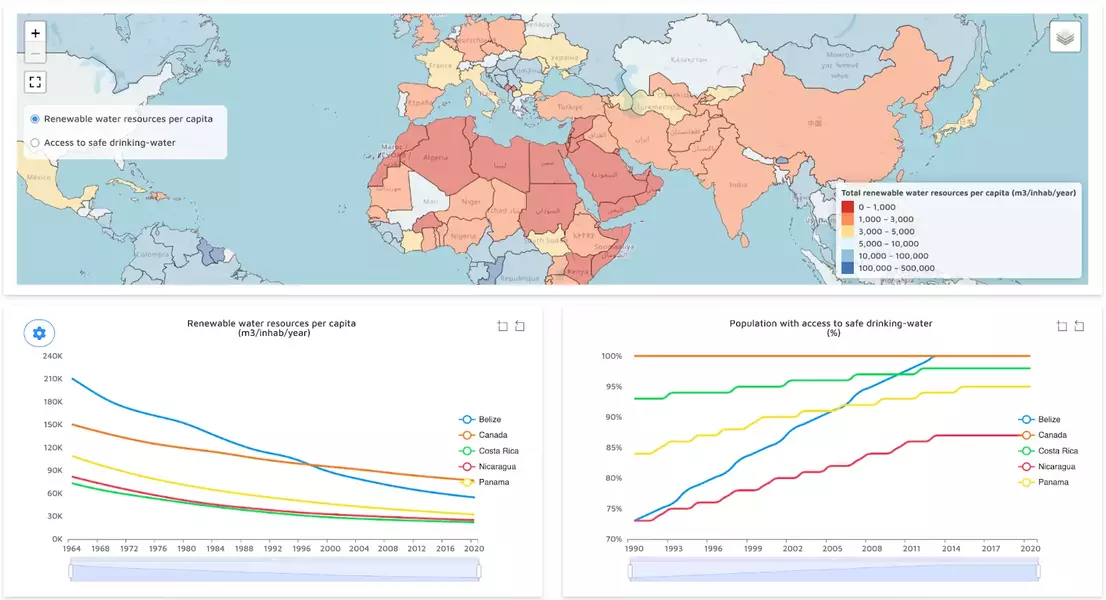
The dashboard features two trend charts that allow users to monitor the availability of renewable freshwater resources per capita and the percentage of the population with access to safe drinking water. These charts cover a span of five decades, from 1964 to 2018, providing a historical perspective on freshwater availability indicators.
The use of interactive elements like legend selector, tooltip & axis selectors within the charts allows users to zoom in, select specific data points, and gain deeper insights. To accomplish this, we utilized the echarts4r package which offers an extensive variety of functions like e_line(), e_legend(), e_x_axis(), e_y_axis(), and e_tooltip(). These functions make it straightforward for developers to easily create interactive charts and graphs. Parameters like animationEasing and animationDuration in e_line() provide a more engaging animation for trend lines. By combining these with Rhino’s modular architecture, we have developed results in a scalable and reusable code base.
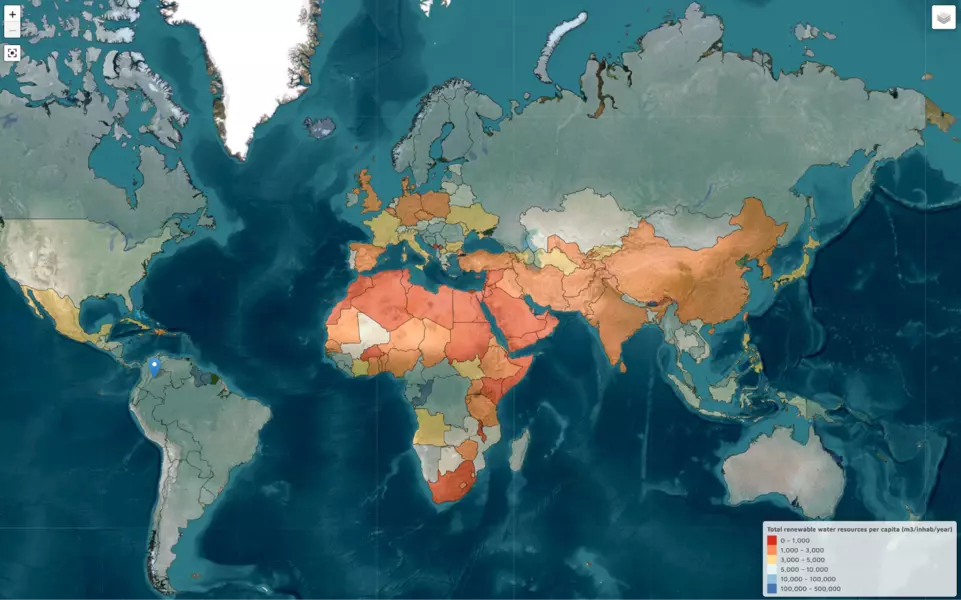
Interactive Map in Shiny
The dashboard features a leaflet map that visually presents geospatial freshwater indicators (separate draggable filter provided) for each country in 2018. By clicking or hovering on individual countries, users can access detailed information about their freshwater availability and access. This interactive map facilitates a global overview while also allowing users to zoom in and explore specific regions of interest.
The dashboard also offers a feature for base map selection. Users can choose to view satellite imagery, open street map (OSM) and toner map (dark and light mode). Additionally, an option to view the map in full screen mode is provided, allowing users to compare the complete globe based on the selected indicator. This feature enhances the user experience by providing flexibility and customization in map visualization.
Bonus – Mobile View📱
By combining the capabilities of Rhino, echarts, and leaflet with the imola package developed by one of our staff engineers, businesses can conveniently access the Freshwater Dashboard on mobile devices, enabling quick insights even on the go. Imola provides a custom breakpoints mechanism, allowing applications to be compatible with different screen sizes. This supports responsive design, which is a key element in modern app design.
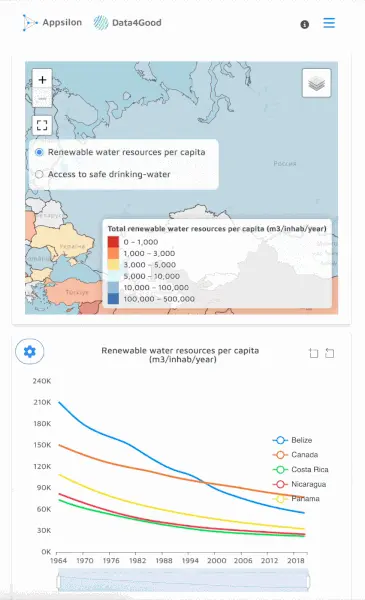
Furthermore, the layout of the dashboard was constructed using imola, further demonstrating the versatility and effectiveness of this package.
UX – Principles vs Reality 🧑🎨
By incorporating these UX concepts and implementing them effectively, this R Shiny dashboard provides an intuitive and user-friendly experience. Users, including business professionals, can seamlessly navigate through the dashboard, explore the data, and extract valuable insights.
This empowers them to make informed decisions and effectively plan for sustainable water usage. The dashboard’s user-centric design ensures that users can access and utilize the data with ease, contributing to their ability to make impactful choices in addressing freshwater scarcity and promoting sustainable practices.
Minimal Cognitive Load and Information Hierarchy
The dashboard maintains a minimalist design approach, emphasizing essential information while reducing cognitive load. By showcasing only the most relevant charts, maps, and filters, users can concentrate on the key indicators without being overwhelmed by unnecessary details.
The inclusion of collapsible filters for continents and countries further enhances the clean and uncluttered interface. This design choice enables users to swiftly locate and interact with the required elements, contributing to a seamless user experience.
Discoverability and Learnability:
The dashboard prioritizes discoverability and learnability, enabling users to intuitively explore and comprehend its features. By incorporating familiar UI elements such as trend charts and interactive maps, the dashboard aligns with users’ existing mental models and reduces the learning curve. This approach ensures that users can quickly understand and navigate the dashboard, enhancing their overall experience and facilitating effective data exploration.
Contextual Feedback and Visual Cues
To enhance usability, the dashboard provides contextual feedback and visual cues that guide users through their interactions. For example, when users select a country on the map, relevant information is displayed, providing immediate feedback on their action.
Interactive elements, such as hovering over data points or zooming into specific time periods in the trend charts, provide real-time visual cues that help users understand the available actions and their consequences.
Flexibility and Customization
The dashboard offers flexibility and customization options to accommodate diverse user preferences and needs. Filters on map and charts are draggable and can be placed anywhere allowing users to create more space for analysis.
Visual Appeal and Data Visualization Best Practices
The dashboard harnesses data visualization best practices to ensure clarity, coherence, and visual appeal. The use of the echarts4r package enables the creation of interactive and visually engaging charts that effectively communicate the trends and patterns in freshwater availability and access. Usage of e_theme() helps in maintaining consistency of style and color palette throughout the dashboard.
Consistency and Familiarity:
Consistency plays a crucial role in UX design, enabling users to navigate and interact with the dashboard effortlessly. The dashboard maintains consistency by adhering to standard UI conventions, such as the placement of navigation elements, filters, and buttons, which align with users’ existing mental models.
This consistency in design patterns and interactions across different components fosters familiarity, reducing cognitive load and enhancing overall usability. By providing a consistent user experience, the dashboard promotes ease of use and ensures a seamless journey for users as they navigate through its various features.
Contextual Help and Information:
The inclusion of the info button on the navigation bar exemplifies the concept of contextual help. By providing comprehensive information about the dashboard, dataset, and technologies used, users can access relevant information without leaving the interface. This contextual help feature enhances the user’s understanding of the dashboard’s purpose, promotes transparency, and enables users to interpret the data effectively.
The R Shiny dashboard for tracking global freshwater availability is designed to be user-friendly and informative. It incorporates intuitive UI and UX elements, making it easy for users, including business professionals, to explore data trends, make informed decisions, and plan for a better future. The dashboard emphasizes usability, transparency, and comprehensive insights, empowering individuals to contribute to better water management practices. By fostering a positive impact on the planet and promoting a sustainable and water-secure future, this dashboard plays a crucial role in promoting responsible water usage 🙏.
Design Your Success 🗣️
Our Data4Good initiative is all about using data science for positive change. Join us in exploring the potential of applied data science solutions. Check out our advanced data dashboards, computer vision, and AI solutions. To learn more about Data4Good projects and how we can collaborate, get in touch with our Data4Good Team.
Contact Us
Project Manager

Get Updates
Subscribe to Shiny Weekly Newsletter
Join 4000+ Shiny enthusiasts to see the latest Shiny news from the R community.