Share
Share Tweet
Tweet Share
Share


Python Pandas vs. R dplyr – Which Data Analysis Library is the best for 2022

06 February 2021
Pandas vs. dplyr
Updated: March 9, 2022.
Python vs. R? Pandas vs. dplyr? It’s difficult to find the ultimate go-to library for data analysis. Both R and Python provide excellent options, so the question quickly becomes “which data analysis library is the most convenient”. Today’s article aims to answer this question, assuming you’re equally skilled in both languages.
Looking for more Python and R comparisons? Check out our Python Dash vs. R Shiny comparison.
As mentioned earlier, this article assumes you are equally skilled in both R and Python. If that’s not the case, it’s likely your decision will be biased, as people tend to approve more of the familiar technologies. We’ll try to provide a completely unbiased opinion based on facts and code comparisons.
Table of contents:
Data Loading
There’s no data analysis without data. Both Pandas and dplyr can connect to virtually any data source, and read from any file format. That’s why we won’t spend any time exploring connection options but will use a build-in dataset instead.
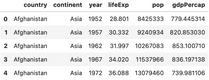
Here’s how you can load Pandas and the Gapminder dataset with Python and Pandas:
The results are shown below:
Image 1 – Library and dataset loading with Pandas
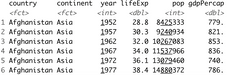
And here’s how you can do the same with R and dplyr:
Here are the results:
Image 2 – Library and dataset loading with dplyr
There’s no winner in this Pandas vs. dplyr comparison, as both libraries are near identical with the syntax.
Winner – tie.
Filtering
This is where things get a bit more interesting. The dplyr package is well-known for its pipe operator (%>%), which you can use to chain operations. This operator makes data drill-downs both easy to write and to read. On the other hand, Pandas doesn’t have such an operator.
Let’s go through three problem sets and see how both libraries compare.
Problem 1 – find records for the most recent year (2007).
Here’s how to do so with Pandas:
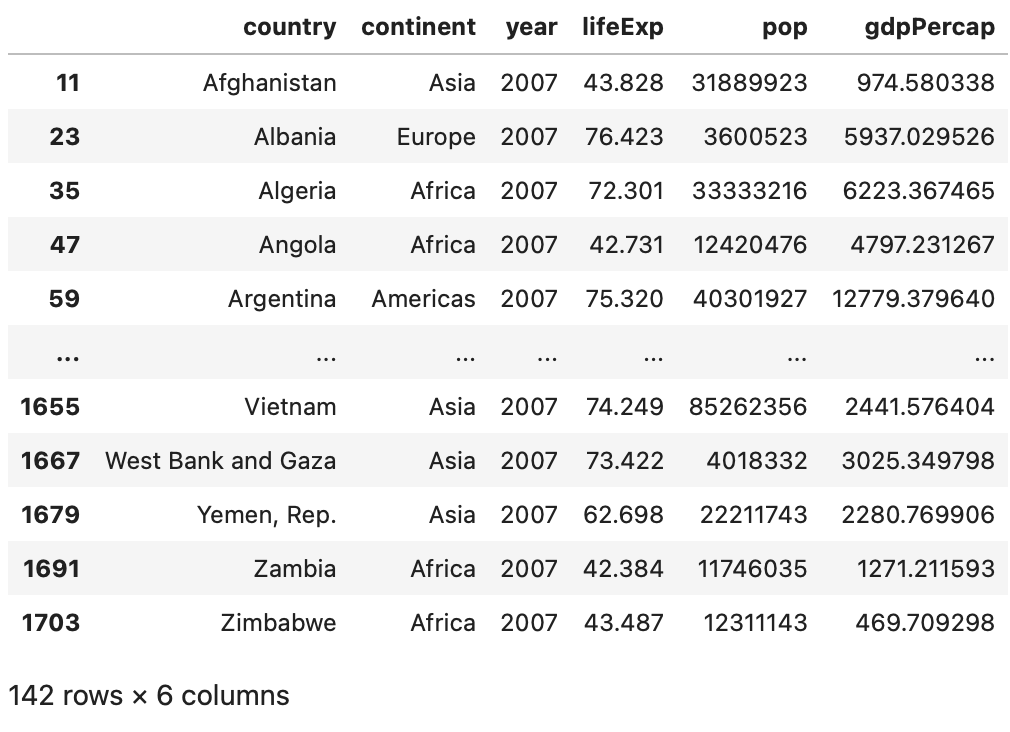
Image 3 – Records from 2007 (Pandas)
And here’s how to do the same with dplyr:
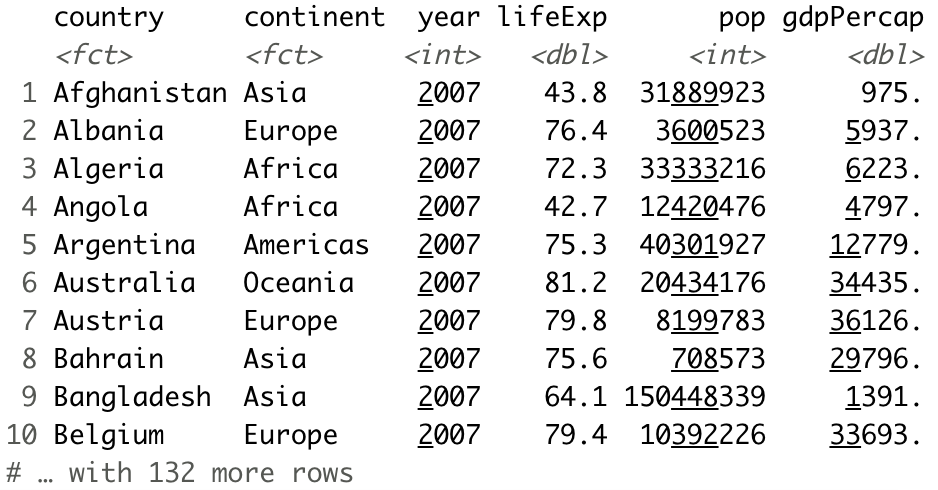
Image 4 – Records from 2007 (dplyr)
As you can see, both libraries are near equal when it comes to simple filtering. It’s common to use the filter() function with dplyr and bracket notation with Pandas. There are other options, sure, but you’ll see these most commonly.
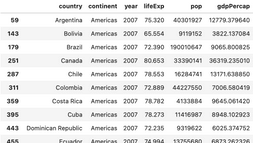
Problem 2 – find records from the most recent year (2007) only for North and South Americas.
Still a pretty simple task, but let’s see the differences in code. Pandas comes first:
Image 5 – Records from 2007 for North and South Americas (Pandas)
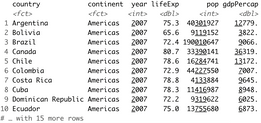
And here’s how to do the same with dplyr:
Image 6 – Records from 2007 for North and South Americas (dplyr)
Applying multiple filters is much easier with dplyr than with Pandas. You can separate conditions with a comma inside a single filter() function. Pandas requires more typing and produces code that’s harder to read.
Problem 3 – find records from the most recent year (2007) only for the United States.
Let’s add yet another filter condition. The Pandas library comes first:
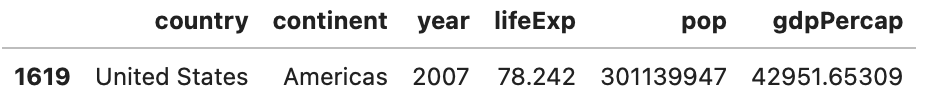
Image 7 – Records from 2007 for the United States (Pandas)
And here’s how to do the same with dplyr:
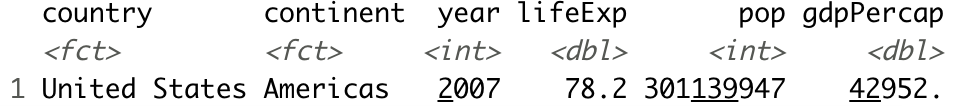
Image 8 – Records from 2007 for the United States (dplyr)
In a nutshell, Pandas is still tough to write, but you can put every filter condition on a separate line so it’s easier to read.
Winner – dplyr. A no-brainer for this Pandas vs. dplyr test. Filtering in dplyr is more intuitive and easier to read.
Summary Statistics
One of the most common data analysis tasks is calculating summary statistics – as a sample mean. This section compares Pandas and dplyr for these tasks through three problem sets.
Problem 1 – calculate the average (mean) life expectancy worldwide in 2007.
It sounds like a trivial problem – and it is. Let’s see how Pandas handles’ it.

Image 9 – Average life expectancy worldwide in 2007 (Pandas)
Let’s do the same with dplyr:
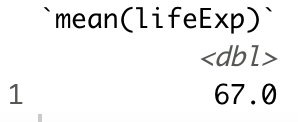
Image 10 – Average life expectancy worldwide in 2007 (dplyr)
As you can see, dplyr uses the summarize() function to calculate summary statistics, and Pandas relies on calling the function on the column(s) of interest.
Problem 2 – calculate the average (mean) life expectancy in 2007 for every continent.
A bit trickier problem, but nothing you can’t handle. The solution requires the use of group by operation on the column of interest. Here’s how to do the calculation with Pandas:
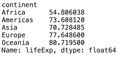
Image 11 – Average life expectancy per continent in 2007 (Pandas)
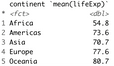
Let’s do the same with dplyr:
Image 12 – Average life expectancy per continent in 2007 (dplyr)
As you can see, both libraries use some sort of grouping functions – groupby() with Pandas, and group_by() with dplyr, which results in a similar-looking syntax.
Problem 3 – calculate the total population per continent in 2007 and sort the results in descending order.
Yet another relatively simple task to do. Let’s see how to solve it with Pandas first:
Image 13 – Total population per continent in 2007 (Pandas)
Let’s do the same with dplyr:
Image 14 – Total population per continent in 2007 (dplyr)
The sorting was the only new part of this problem. Pandas uses the sort_values() function with an optional ascending argument, while dplyr uses the arrange() function.
Winner – tie. Declaring a winner in this Pandas vs. dplyr test boils down to personal preference. Pandas seems to be a bit more cluttered, but that’s due to the initial filtering. Calculating summary statistics in both is easy.
Creating Derived Columns
This is the last series of tasks in today’s comparison. We’ll explore how easy it is to do feature engineering in both libraries. There are only two problem sets this time.
Problem 1 – calculate the total GDP by multiplying population and GDP per capita.
This should be easy enough to do. Let’s see the Pandas implementation first:
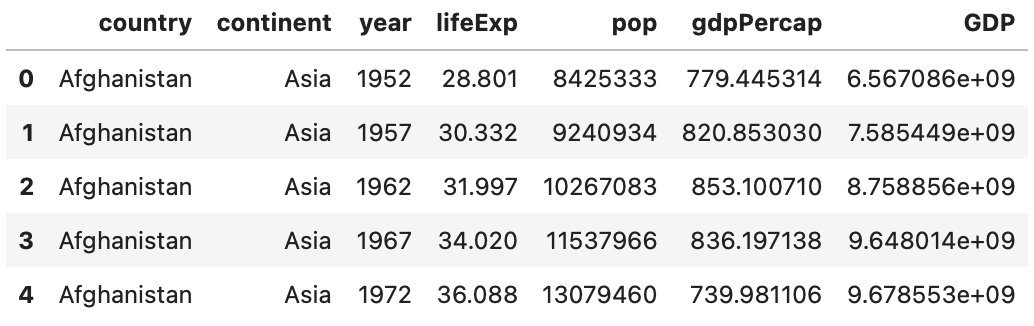
Image 15 – Calculating total country GDP (Pandas)
And now let’s do the same with dplyr:
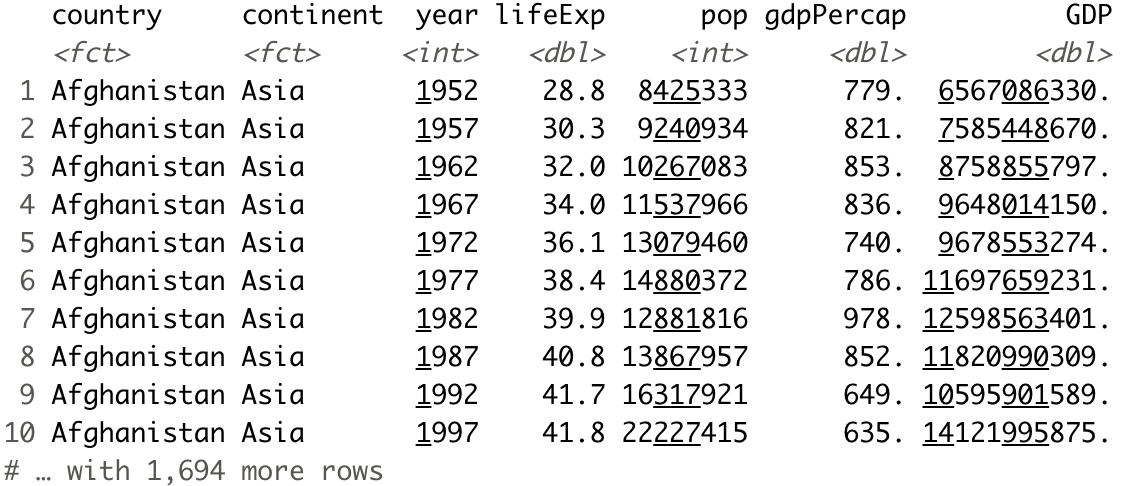
Image 16 – Calculating total country GDP (dplyr)
A call to the head() function in Pandas isn’t a part of the solution but is here only to print the first couple of rows instead of the entire dataset. Implementation in both was straightforward, to say at least.
Problem 2 – print the top ten countries in the 90th percentile with regards to GDP per capita.
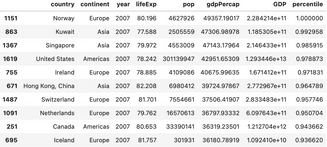
This one is a bit trickier, but nothing you can’t handle. Let’s see how to solve it with Pandas:
Image 17 – Top 10 countries in the 90th percentile wrt GDP per capita (Pandas)
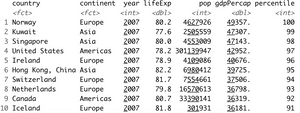
And now let’s do the same with dplyr:
Image 18 – Top 10 countries in the 90th percentile wrt GDP per capita (dplyr)
We’ve created an additional data frame in Pandas for convenience’s sake. Still, the implementation in dplyr is much simpler and easier to read, making R’s dplyr the winner of this section.
Winner – dplyr. Another no-brainer Pandas vs. dplyr comparison. The syntax of dplyr is much cleaner and easier to read.
Plotting
We’ll now take a look at how good each contestant is with visualizing data. We won’t compare external libraries, e.g., Matplotlib in Python and GGplot in R – but only what Pandas and dplyr have to offer.
Let’s start with Pandas. We’ll create a small subset that contains only the data for Poland – pl_gapminder:
Pandas makes it easy to plot basic charts. You can call the plot() function on a DataFrame and Pandas will take care of the rest. Keep in mind – if plotting multiple columns, one of them should be set as an index:
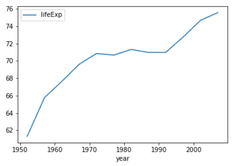
Image 19 – Life expectancy over time in Poland
It’s not the best-looking visualization, nor it’s in high resolution. The plotting capabilities of Pandas are quite limited, and you’re better off using a dedicated data visualization library.
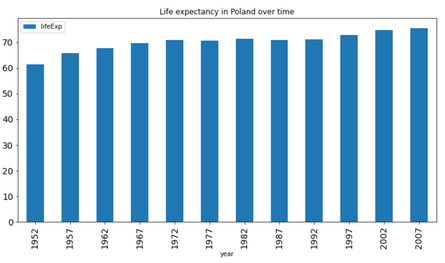
You can tweak the basics, such as figure size, title, font size, and the type of the chart – but that’s pretty much it:
Image 20 – Life expectancy in Poland as a bar chart
It’s still much more than what R’s dplyr has to offer. It’s a pure data analysis and manipulation library and has no data visualization functionality. For that reason, we have to declare Pandas as the winner of this section.
Winner – Pandas. But does it matter? You’ll almost always use a dedicated data visualization library.
Conclusion
According to the test made in this article, dplyr is a clear winner. Does that mean you should abandon Pandas once and for all? Well, no.
How well you’ll solve data analysis tasks depends much on the level of familiarity with the library. If you’re a big-time Pandas user, solving tasks with dplyr might seem unnatural, resulting in more time spent solving the task. Use the library that’ll save you the most time.
If you’re equally skilled in both, there’s virtually no debate on which is “better”.
Learn More
- 7 Must-Have Skills to Get a Job as a Data Scientist
- Introduction to SQL: 5 Key Concepts Every Data Professional Must Know
- Hands-on R and dplyr – Analyzing the Gapminder Dataset
- Machine Learning with R: A Complete Guide to Linear Regression
- Machine Learning with R: A Complete Guide to Logistic Regression
Contact Us
Project Manager

Get Updates
Subscribe to Shiny Weekly Newsletter
Join 4000+ Shiny enthusiasts to see the latest Shiny news from the R community.