
{shiny.telemetry}: Enhanced User Behavior Analytics in R/Shiny Dashboards
Do you often find yourself developing an R/Shiny dashboard and wish you knew how your users were using the dashboard, which views are being used the most and how inputs are being modified? If so, the {shiny.telemetry} R package might be just what you’re looking for.
In this post, we’ll introduce you to this powerful package and show you how it can enhance your understanding of how your dashboard is being used.
We are announcing the second release of {shiny.telemetry} with v0.2.0 that adds the “Microsoft SQL Server” database as a new storage provider, among other bug fixes.
Table of Contents
- What is {shiny.telemetry}?
- Monitoring Input and Custom Events
- Where to Save the Data?
- How to Look at the Insights?
- The Impact of Shiny Telemetry
What is {shiny.telemetry}?
{shiny.telemetry} was first released on CRAN in May 2023, and it adds the tools to study how users interact with an R/Shiny application.
One of our main design goals with this package is for it to be easy to use and to integrate with existing codebases. With that in mind, the minimal integration only requires 3 lines of code, and you are good to go!
library(shiny)
library(shiny.telemetry)

telemetry <- Telemetry$new() # 1. Initialize telemetry with default options (store to a local logfile)

shinyApp(
  ui = fluidPage(
    use_telemetry(), # 2. Add necessary Javascript to Shiny
    numericInput("n", "n", 1),
    plotOutput('plot')
  ),
  server = function(input, output) {
    telemetry$start_session() # 3. Minimal setup to track events
    output$plot <- renderPlot({ hist(runif(input$n)) })
  }
)
This will track a set of inputs and actions out-of-the-box with the start_session() call:
- Length of a session.
- Username detection on Posit Connect instances (customizable for other deployments).
- Browser being used.
- All inputs that are being changed.
- By default, the values are not stored with default configuration.
These default options can be further extended to support navigation detection when using tabs or {shiny.router}, or disabled to match your needs, as we see in the next section.
Monitoring Input and Custom Events
Listening to all events that an R/Shiny application triggers may be enough for most use cases. For those that need extra customization, {shiny.telemetry} has you covered by allowing you to track specific inputs or side-effects of the user interaction as custom events.
This can be due to an excessive verbose application that triggers too many inputs during a session, or if the raw value is not the best target to track, instead a calculated reactive value or other side effects contain more informative data.
The {shiny.telemetry} API allows you to explicitly define which inputs to track when the automated tracking of all inputs in telemetry$start_session() is disabled.
c("input1", "input2", "input4") |>
  purrr::walk(shiny.telemtry::log_input)
Or at a lower level, by observing changes directly and generating a log event every time the specific input or reactive value changes.
In the snippet of code below, we are tracking a reactive value that is changed on a click to a {plotly} plot (the year selection of the Olympic History demo).
# Plotly event_data
year_selected <- reactive(event_data("plotly_click", source = "timeline")$x)

# Observing a reactive value
observeEvent(year_selected(), {
  telemetry$log_custom_event(
      "input", # simulating it as an input event. May take any other name
      details = list(
        id = "timeline",
        value = year_selected()
      )
 )
})
# ...
Where to Save the Data?
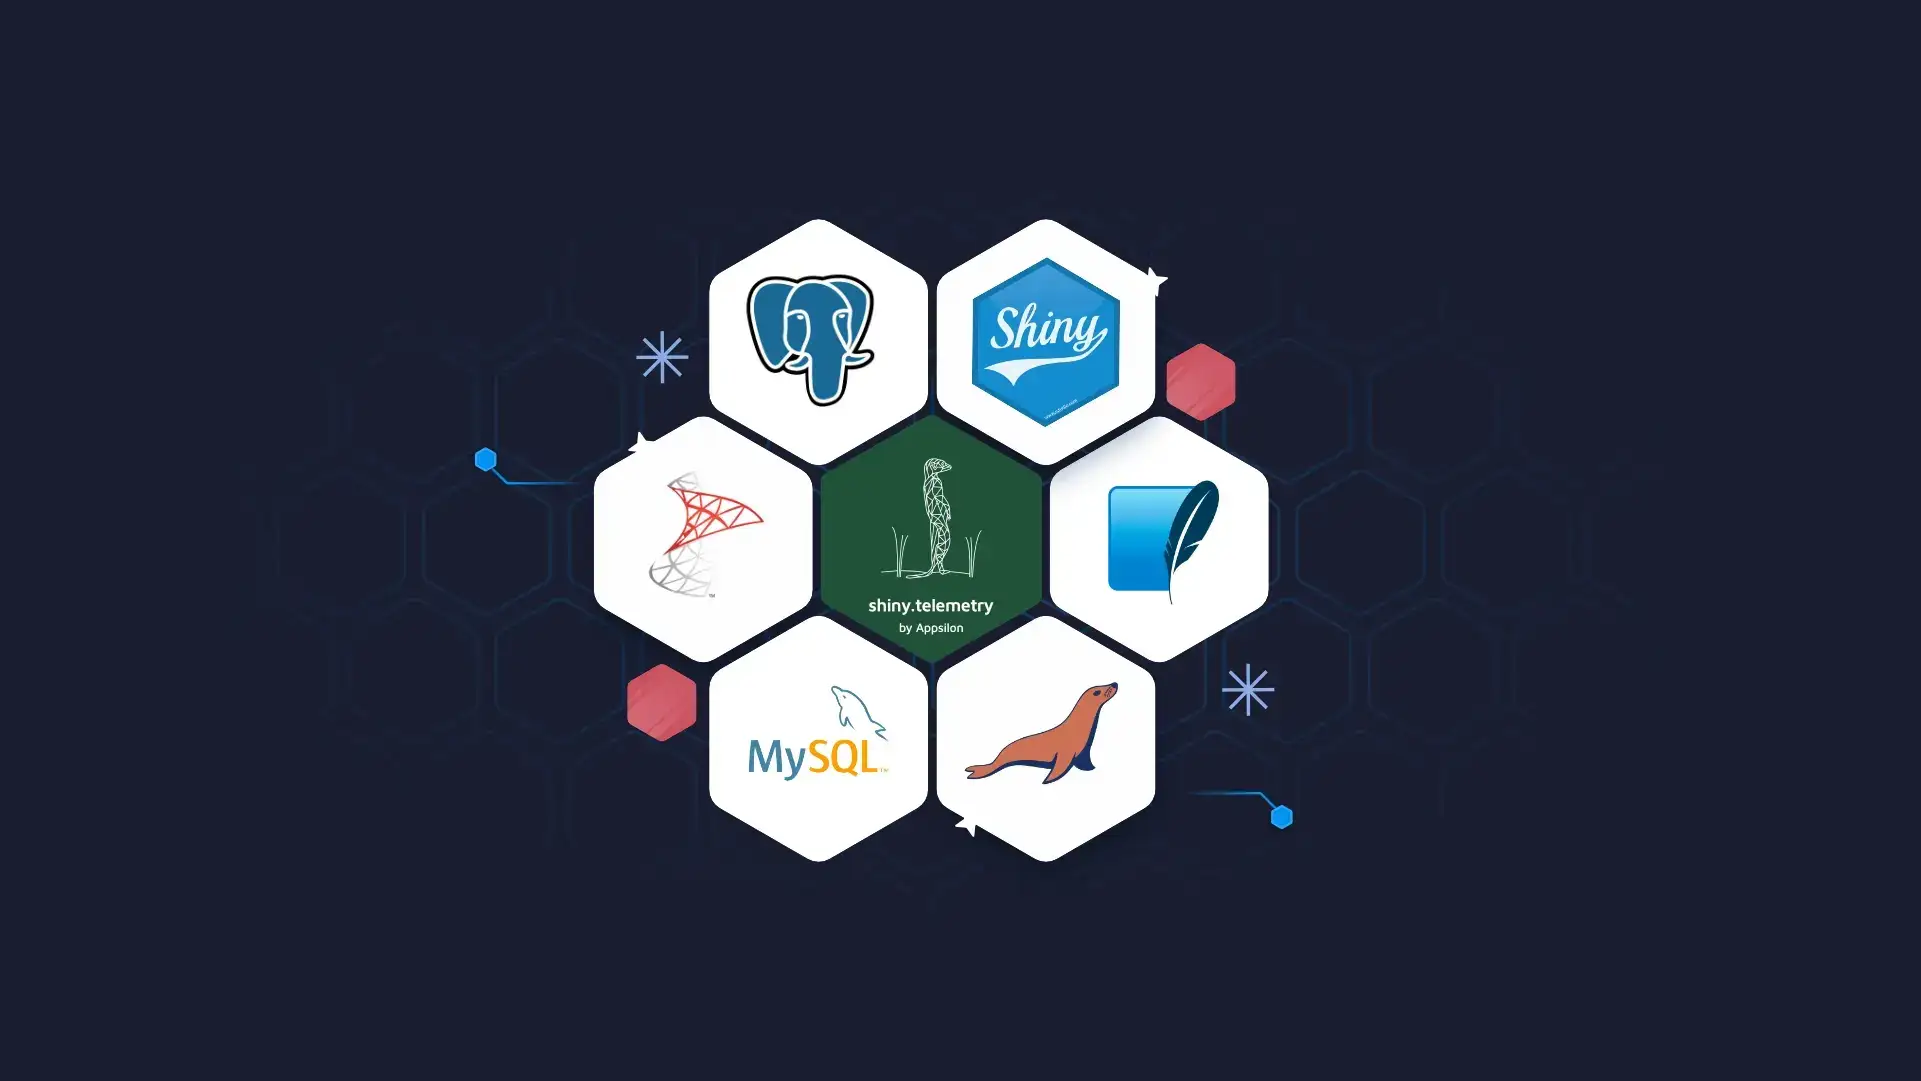
{shiny.telemetry} has an extensible framework of data-storage providers, allowing you to tailor the storage solution that best suits your needs. We support 6 different data-storage providers, some are local, and some are remote. Additionally, you can also use a REST API layer that can serve as a bridge from the application with any of the storage providers.
The data can be stored locally on the deployment with a text file or SQLite database, or to a remote/local relational database.
This package currently supports SQL-family databases such as MariaDB/MySQL, PostgreSQL and Microsoft SQL server (the latter one is added in the latest release).

SQL-family Databases
We also support a Plumber REST API that can, in turn, store on all storage providers using the HTTP(S) protocol to securely communicate the telemetry data. This can be an option if a relational database cannot be deployed on your environment.
How to Look at the Insights?
{shiny.telemetry} comes with a minimal R/Shiny dashboard that allows you to look at the data that is being collected. It shows the session, navigation, input and user metrics allowing one to look at the individual details of each.
We have a sample dashboard with a few inputs and tab navigation that uses {shiny.telemetry}.
Feel free to interact with that dashboard and then see the results on the demo analytics application that is shipped with {shiny.telemetry}.

Dashboard
📝 Please note that the data is cleaned periodically.
This demo deployment uses local data storage, and it is fully deployed on Posit Connect. You can inspect and learn from this deployment by looking at the two folders under shiny.telemetry/inst/examples/app. This allows for the sample dashboard to be deployed and re-deployed without losing all the data as it is stored in a different instance running the Plumber REST API.
The Impact of Shiny Telemetry
Try {shiny.telemetry} yourself on your applications and let us know on Linkedin how you feel about it.
{shiny telemetry} is already being used on our projects and with our clients to help us better understand the users of a dashboard and improve on it to deliver the best possible user experience as per our Shiny Manifesto.
To continue reading about {shiny.telemetry} and how we integrated it with our demos, check out the fantastic blog post and work by Andres Quintero that combines multiple dashboards’ telemetry in a single visualization.
Impressed by the insights from {shiny.telemetry}? Let us show you how it can revolutionize your dashboard analytics. Get in touch!


