Share
Share Tweet
Tweet Share
Share


We Have Created a Package to Improve the UI of Shiny Dashboards

15 December 2016
Why?
It’s always a challenge, when developing Shiny apps to create a user interface that is not only acceptable, but rather an exceptionally good looking one. Although Shiny is amazing framework it lacks a set of tools to improve both user experience and interface, like customized and modular components. Just imagine getting customized menu for your app or a really good looking search component.
At the same time projects we build using Shiny are created 10x faster than traditional web apps, and we don’t want to rewrite everything from scratch.
What was our decision?
We’ve seen many teams rewriting their R projects into web apps using API endpoints or even rewriting analytical models in Ruby or C#. Some people were even trying to convince us that learning Angular is a good idea for a data scientist.
We definitely encourage learning new skills, but it doesn’t make sense for everyone to be good at everything. Especially if you already deliver results 10x faster.
Instead of rewriting everything from scratch we’ve decided to solve it once and for all by creating a package wrapping one of the best web libraries there is on the market and start using it from now on onwards in our internal and external R projects.
Thankfully Shiny is easily extendable. To make it easier for us we have integrated Semantic UI into Shiny framework as a package. This way it is extremely easy to start developing apps that are reactive, easy to use and look beautiful. The effect of combining Shiny with Semantic UI is our shiny.semantic package which you can find here. It’s on MIT license so it’s really up to you how you are going to use it.
You can find some examples of our dashboards below:
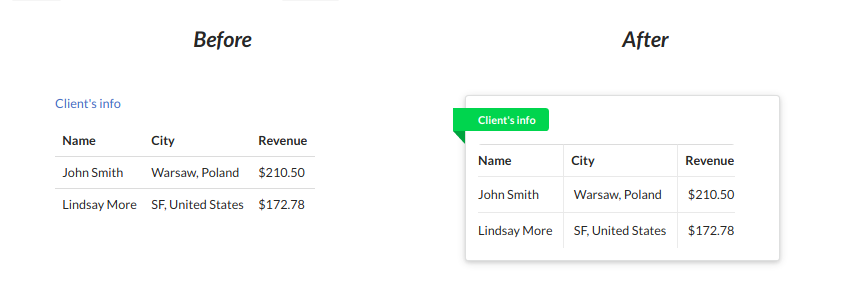
Before and after applying shiny.semantic to a UI element.
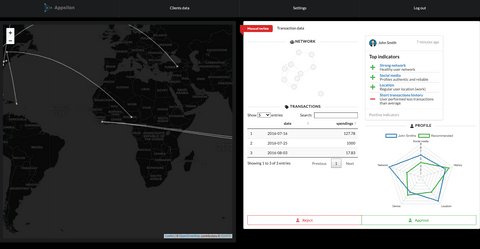
Sample Shiny dashboard for fraud detection, built with shiny.semantic.
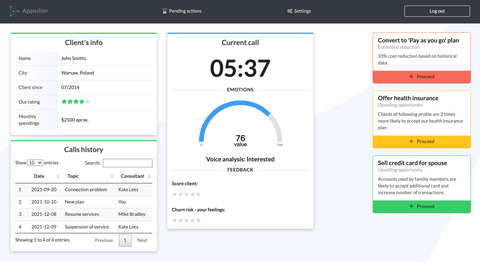
Sample Shiny dashboard for churn analysis, built with shiny.semantic.
Sample Shiny dashboard for water quality.
Next steps
Make sure to check our github repository and a demo page with examples of components created directly in R Shiny.
There is still a lot of work to make it easier for us to create better interfaces faster. Contributors are kindly welcome!
Contact Us
Project Manager

Get Updates
Subscribe to Shiny Weekly Newsletter
Join 4000+ Shiny enthusiasts to see the latest Shiny news from the R community.