
Apache Arrow in R – Supercharge Your R Shiny Dashboards with 10X Faster Data Loading


 Share
Share Tweet
Tweet Share
ShareNobody likes a slow dashboard. Heck, I’m closing it and never coming back if it takes more than a couple of seconds to load. It’s a common problem — the datasets are getting bigger and our attention span is getting shorter. Balancing both as a developer, well, sucks.
But there might be a silver lining. Most of the available datasets have one thing in common — the file extension. It’s typically a CSV, and it’s what’s giving you headaches.
Don’t get me wrong — CSV’s have a lot going for them. You can easily open CSV files, see what’s inside, and even modify data on the fly. It’s a human-readable format, and tools like Excel can open it without questions asked. The problem is — CSV’s aren’t compressed, and take 6 times longer to read, 12 times longer to write, and 4 times the size on disk, provided a relatively small 50 MB dataset.
Things only go south for CSV format as the file size increases. That’s why today you’ll learn about an alternative — Apache Arrow — and see how to use it in R and R Shiny dashboards.
Table of contents:
- Apache Arrow Crash Course
- How to Work With Apache Arrow in R
- Benchmarks — Vanilla R vs. Apache Arrow
- Apache Arrow in R Shiny — How to Speed Up Your Dashboards
- Conclusion
Apache Arrow Crash Course
Apache Arrow is a cross-language development platform for in-memory data. It’s designed for efficiency and moves away from your typical row-orientated storage (think CSV) to columnar storage.
This change allows for adequate compression to be applied, so you end up with a smaller file that’s easier to read and write. Columnar storage also allows you to skip irrelevant data quickly, which results in faster queries and aggregations.
Better performance doesn’t have to be difficult. Explore Appsilon’s definitive guide to speeding up R Shiny.
Apache Arrow supports CSV, JSON, Parquet, and Feather file-formats locally, and Amazon S3 buckets in the cloud. Everything is implemented through a familiar dplyr syntax. That’s right — you won’t have to learn a new library from scratch.
The library comes with two data structures:
Table— A tabular, column-orientated data structure capable of storing and processing large amounts of data more efficiently than R’s built-indata.frame.Dataset— a data structure similar toTable, but capable to work on larger-than-memory datasets.
Apache Arrow comes with a bunch of functions for reading data: read_parquet(), read_feather(), read_delim_arrow(), read_csv_arrow(), read_tsv_arrow(), read_json_arrow(), and all of these will return an R data.frame by default. You can specify an additional argument as_data_frame = FALSE to return an Arrow Table.
The options for writing data are more limited. You can only write CSV, Parquet, and Feather files, alongside the raw format and IPC stream, which you won’t use that often. The functions are named just as you would expect — write_csv_arrow(), write_feather(), and write_parquet().
Arrow also uses lazy evaluation, which means you’ll need to call either compute() or collect() to perform computations. The first one returns an Arrow Table, and the second one an R data.frame.
You can install Apache Arrow just like any other package:
Please do so if you plan to follow along. We’ll start by downloading and exploring a simple 50 MB dataset in the next section.
How to Work With Apache Arrow in R
Let’s start by downloading the NYSE prices dataset from Kaggle:
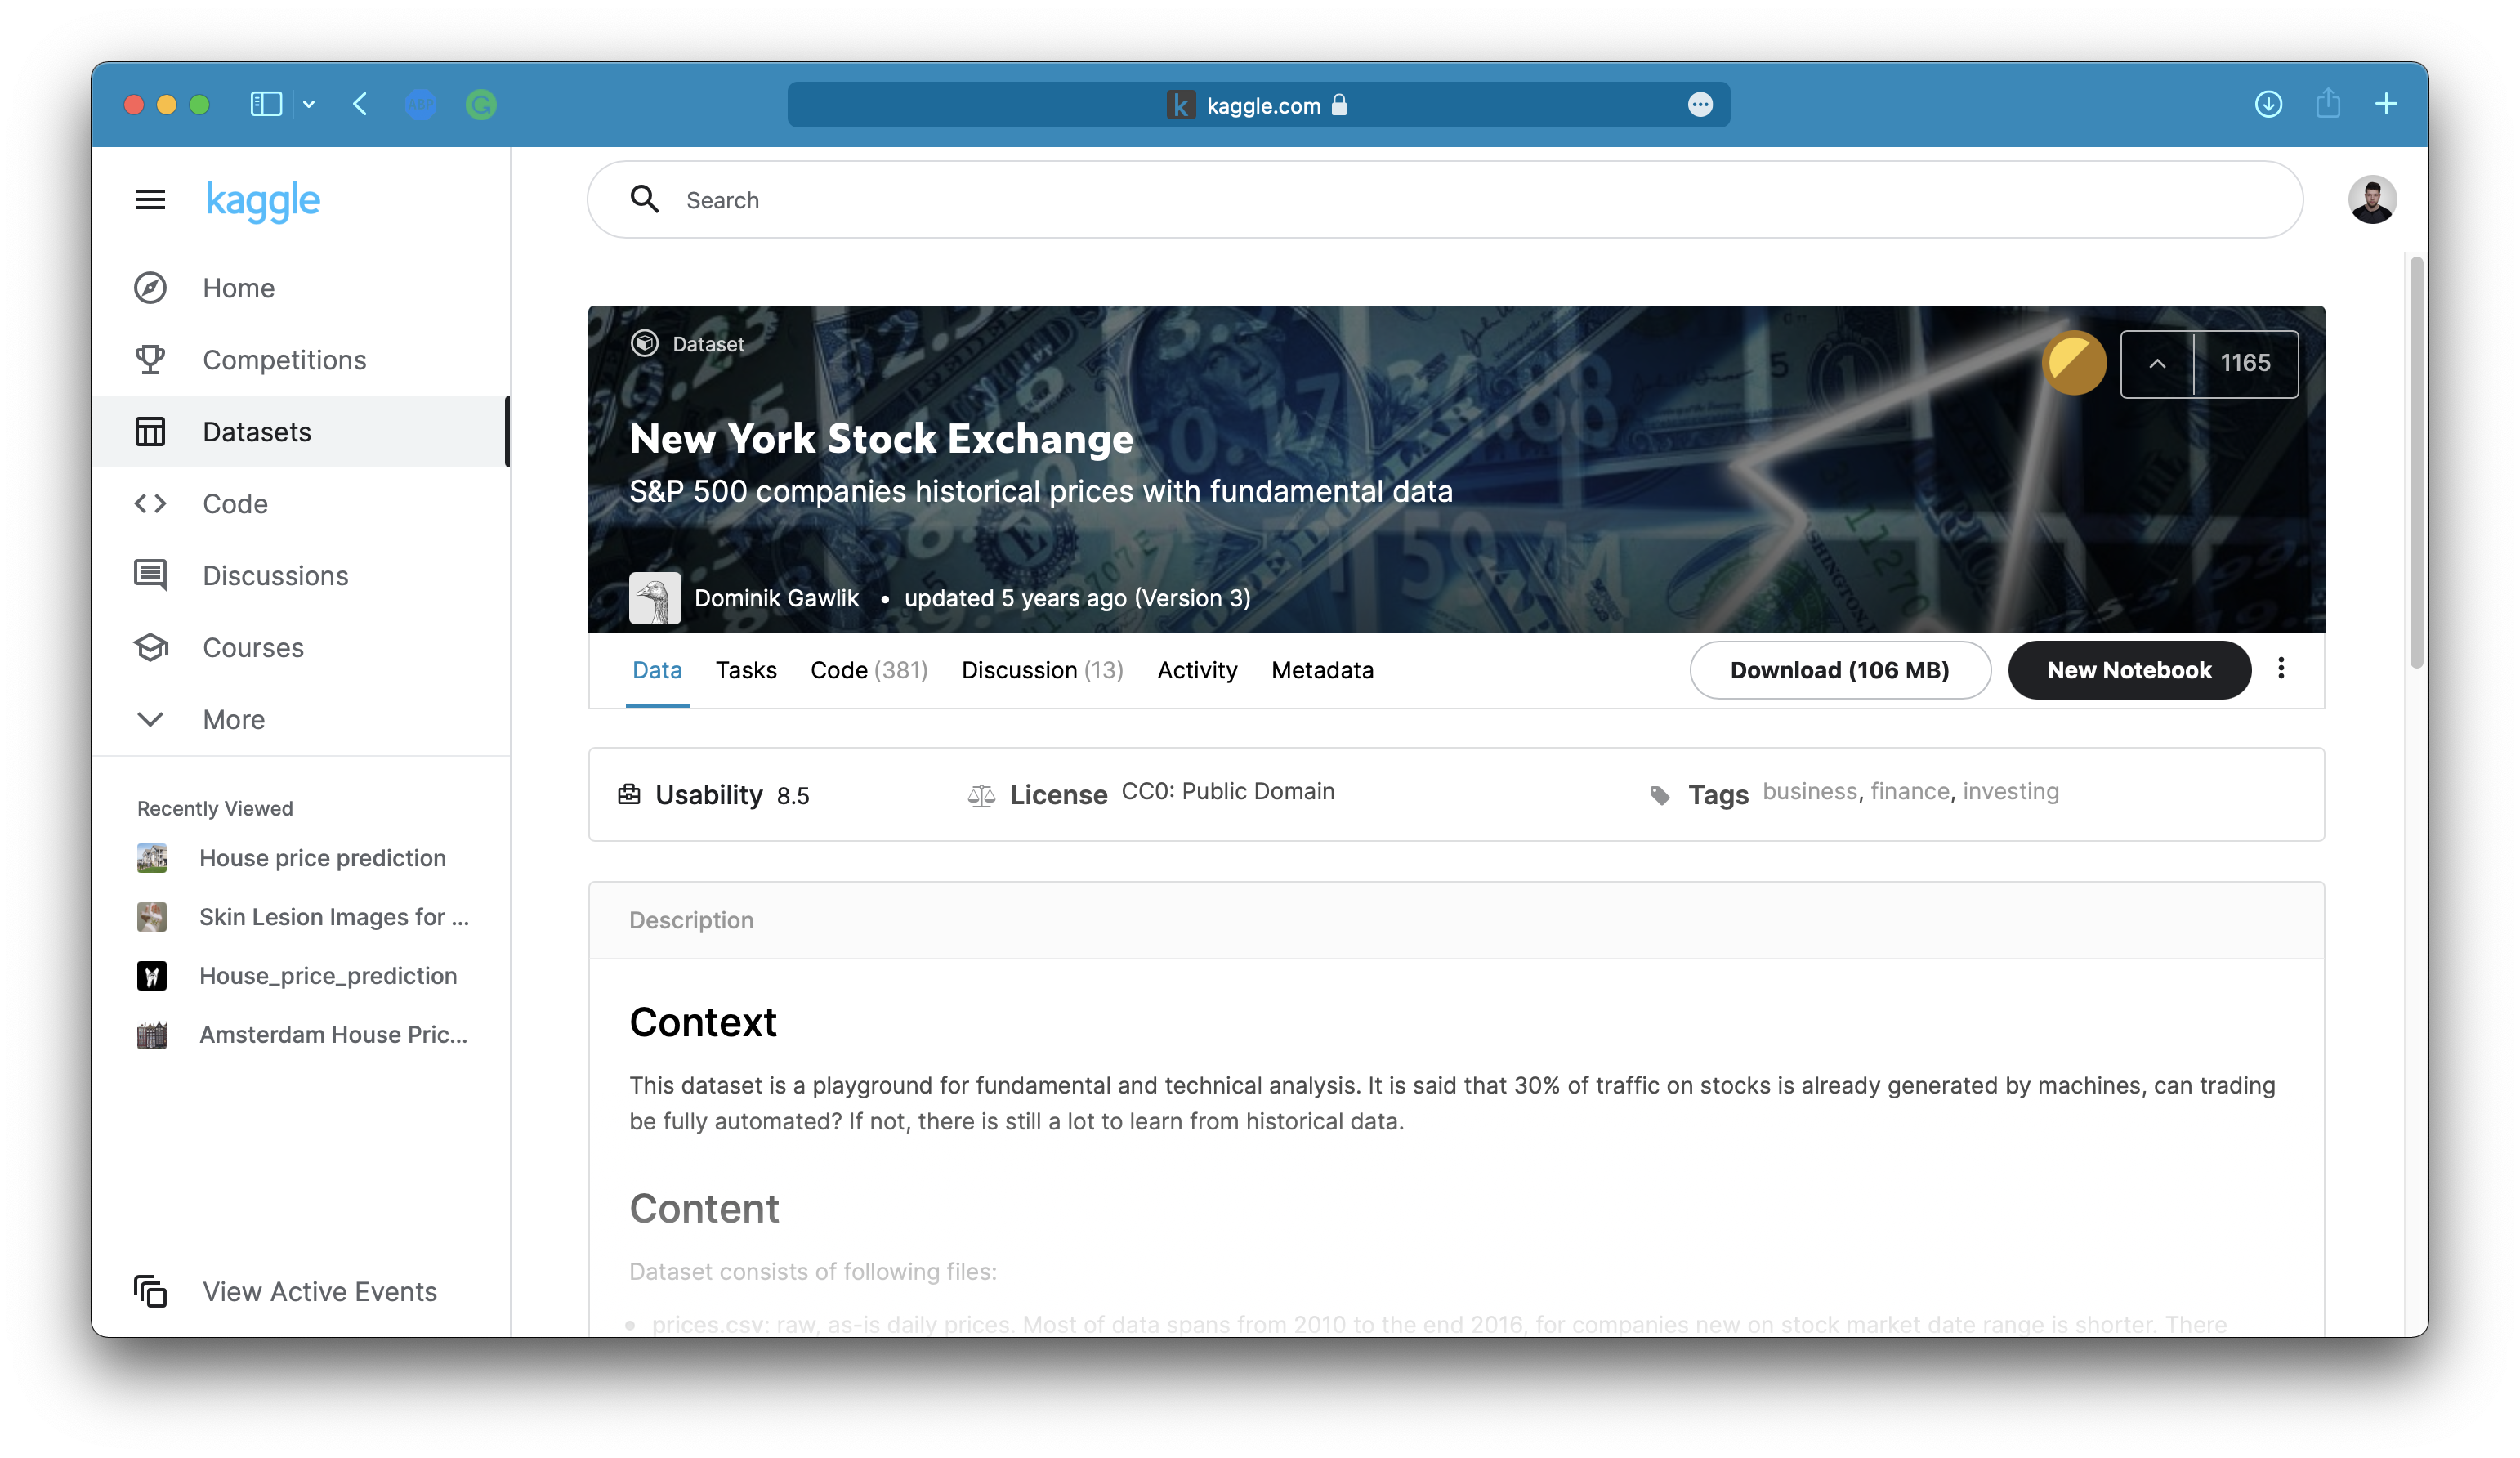
Image 1 – The NYSE dataset
You’ll only need the prices.csv file, so don’t waste your time by downloading the others. Once downloaded, create a new R script and you’re good to go.
You can start by changing the working directory to where your CSV file is located and importing the libraries. You’ll need arrow and dplyr:
The warn.conflicts = FALSE will make sure you don’t get unnecessary warning messages printed to the console.
You can now use the read_csv_arrow() function to read in the dataset. Keep in mind — specifying as_data_frame = FALSE will return an Arrow Table, which is what you want for faster computations:
And that’s the only change you need to make when reading data.
The stock_prices is stored as a Table, but you can still do any data manipulation you want with dplyr. For instance, the following code snippet keeps only the Netflix data and gets rid of a couple of columns:
The problem is — Arrow uses lazy evaluation, so no computation is done until you call either compute() or collect(). You can verify that by printing out nflx to the console:

Image 2 – Working with Arrow in R (1)
If you call the compute() function, yet another Table object is returned:
Image 3 – Working with Arrow in R (2)
And if you call collect(), you’ll get the filtered dataset in the R data.frame format:
Image 4 – Working with Arrow in R (3)
To summarize, the changes you need to make are minimal — an additional line of code here and there, but the speed and disk improvements are worth it. If you’re still skeptical, check the following benchmark section.
Benchmarks — Vanilla R vs. Apache Arrow
You’ll now get the idea of just how much vanilla R is slower for reading/writing datasets than Apache Arrow. Execution times were measured with Sys.time() function in R. The prices.csv file was used for all tests.
Benchmark 1 — Reading CSV files
Here, a comparison was made between R’s read.csv() function and Arrow’s read_csv_arrow() function. The results are summarized on the following chart:
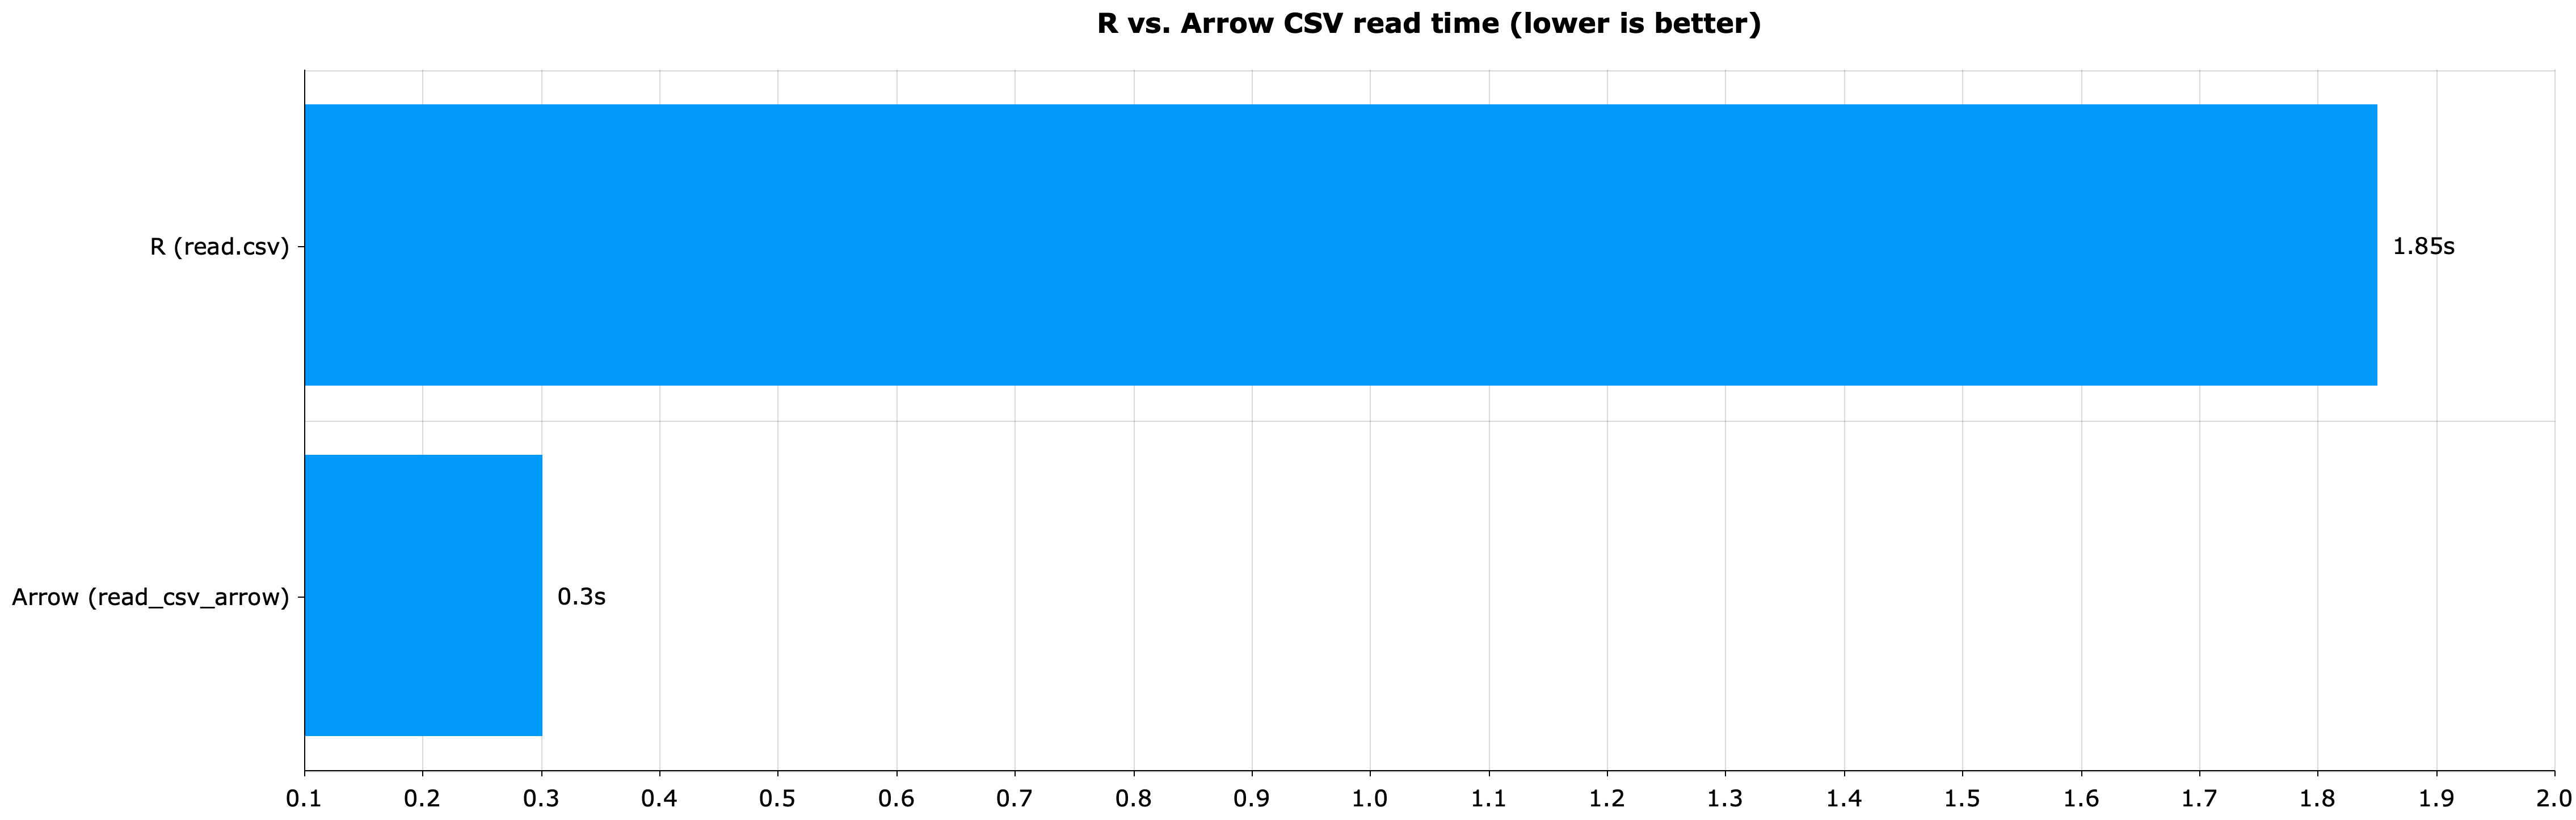
Image 5 – R vs. Apache Arrow in CSV read time (R: 1.85s; Arrow: 0.3s)
That’s more than a 6x speed decrease when reading CSV files — insane. In addition, if as_data_frame = FALSE was specified in the Apache Arrow function call, the execution took only 0.13 seconds, which is a 14x speed decrease.
Benchmark 2 — Writing files to disk
You’ll want to use Arrow for working with Parquet and Feather files, which are extremely efficient, both in runtime and size on disk. The following chart shows you the runtime difference between R’s write.csv() and Arrow’s write_parquet() and write_feather() functions:
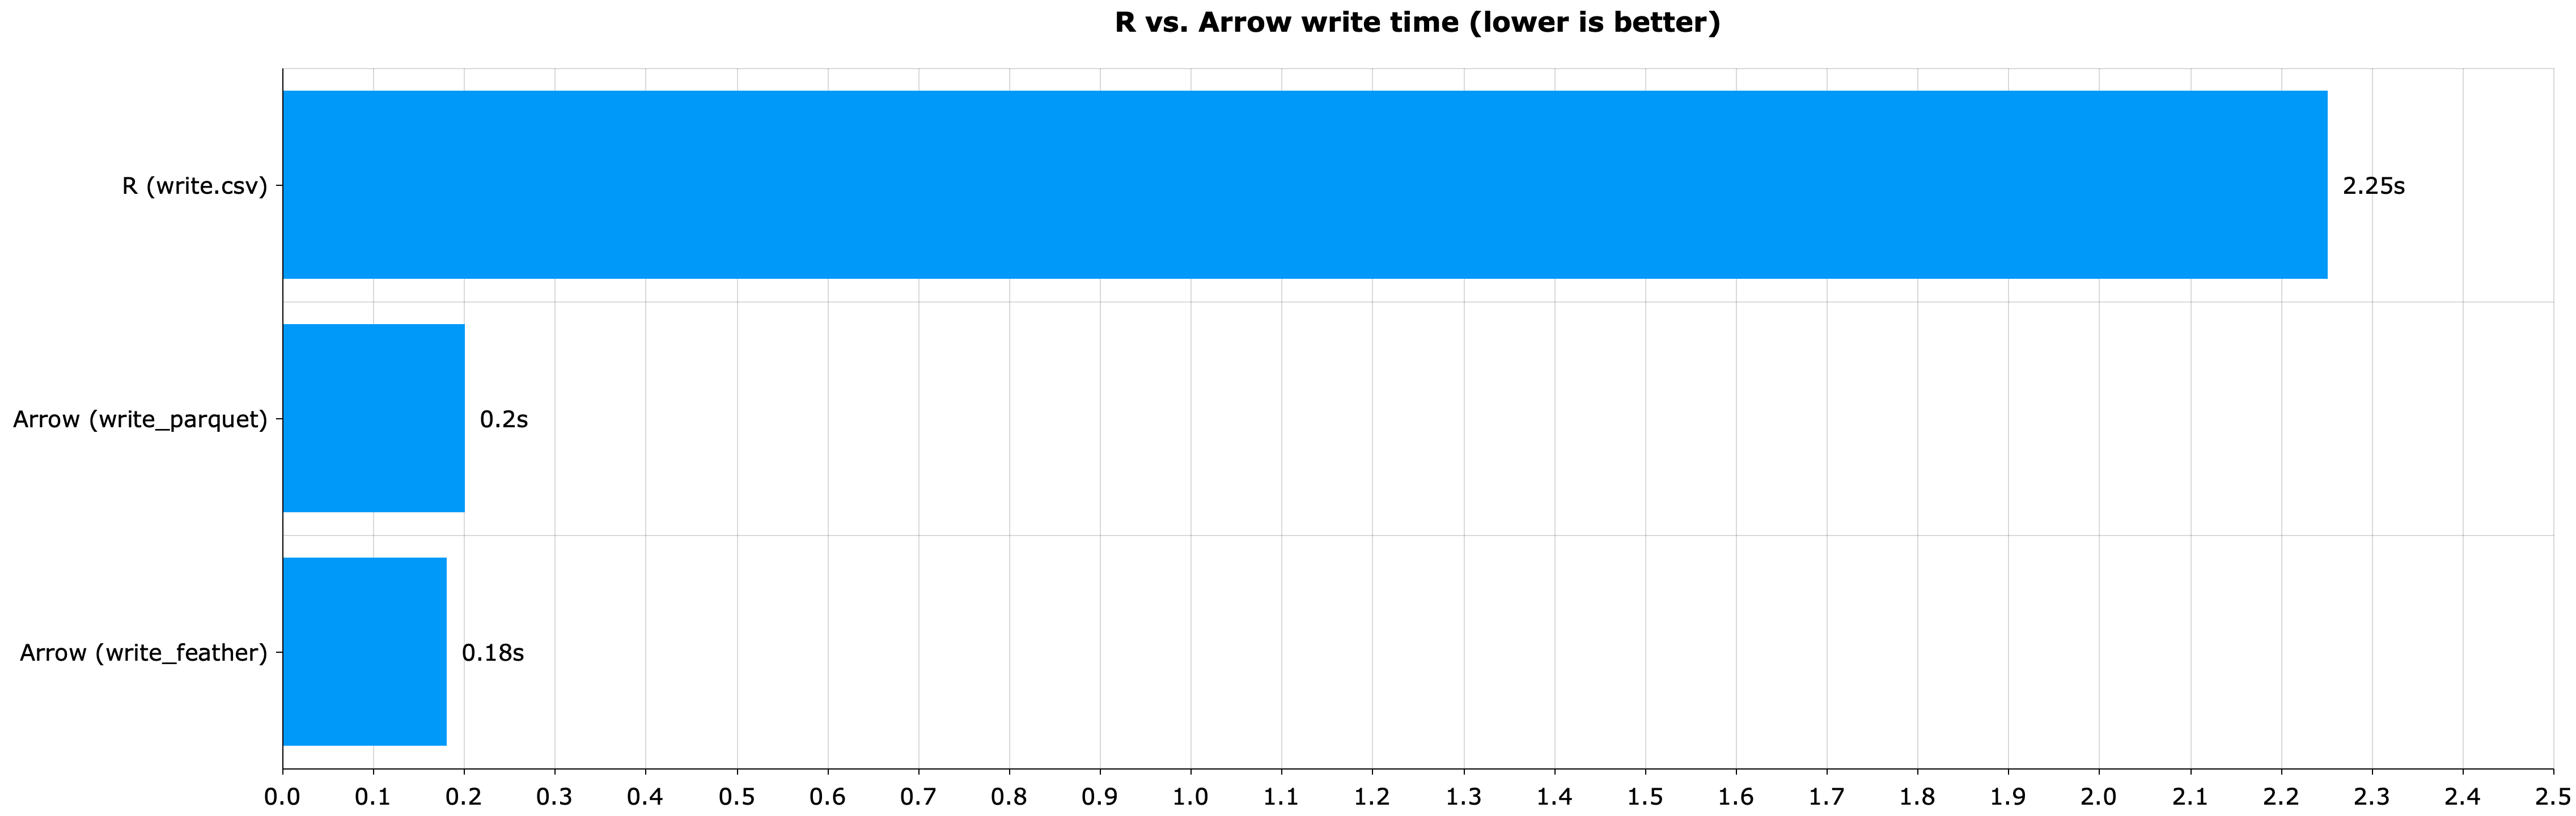
Image 6 – R vs. Apache Arrow in write time (R CSV: 2.25s; Arrow Parquet: 0.2s; Arrow Feather: 0.18s)
And just like that, a 12x decrease in speed when writing datasets to disk. But how much smaller is the file? Let’s answer that next.
Benchmark 3 — File size on disk
The results are nothing short of astonishing. Take a look for yourself:
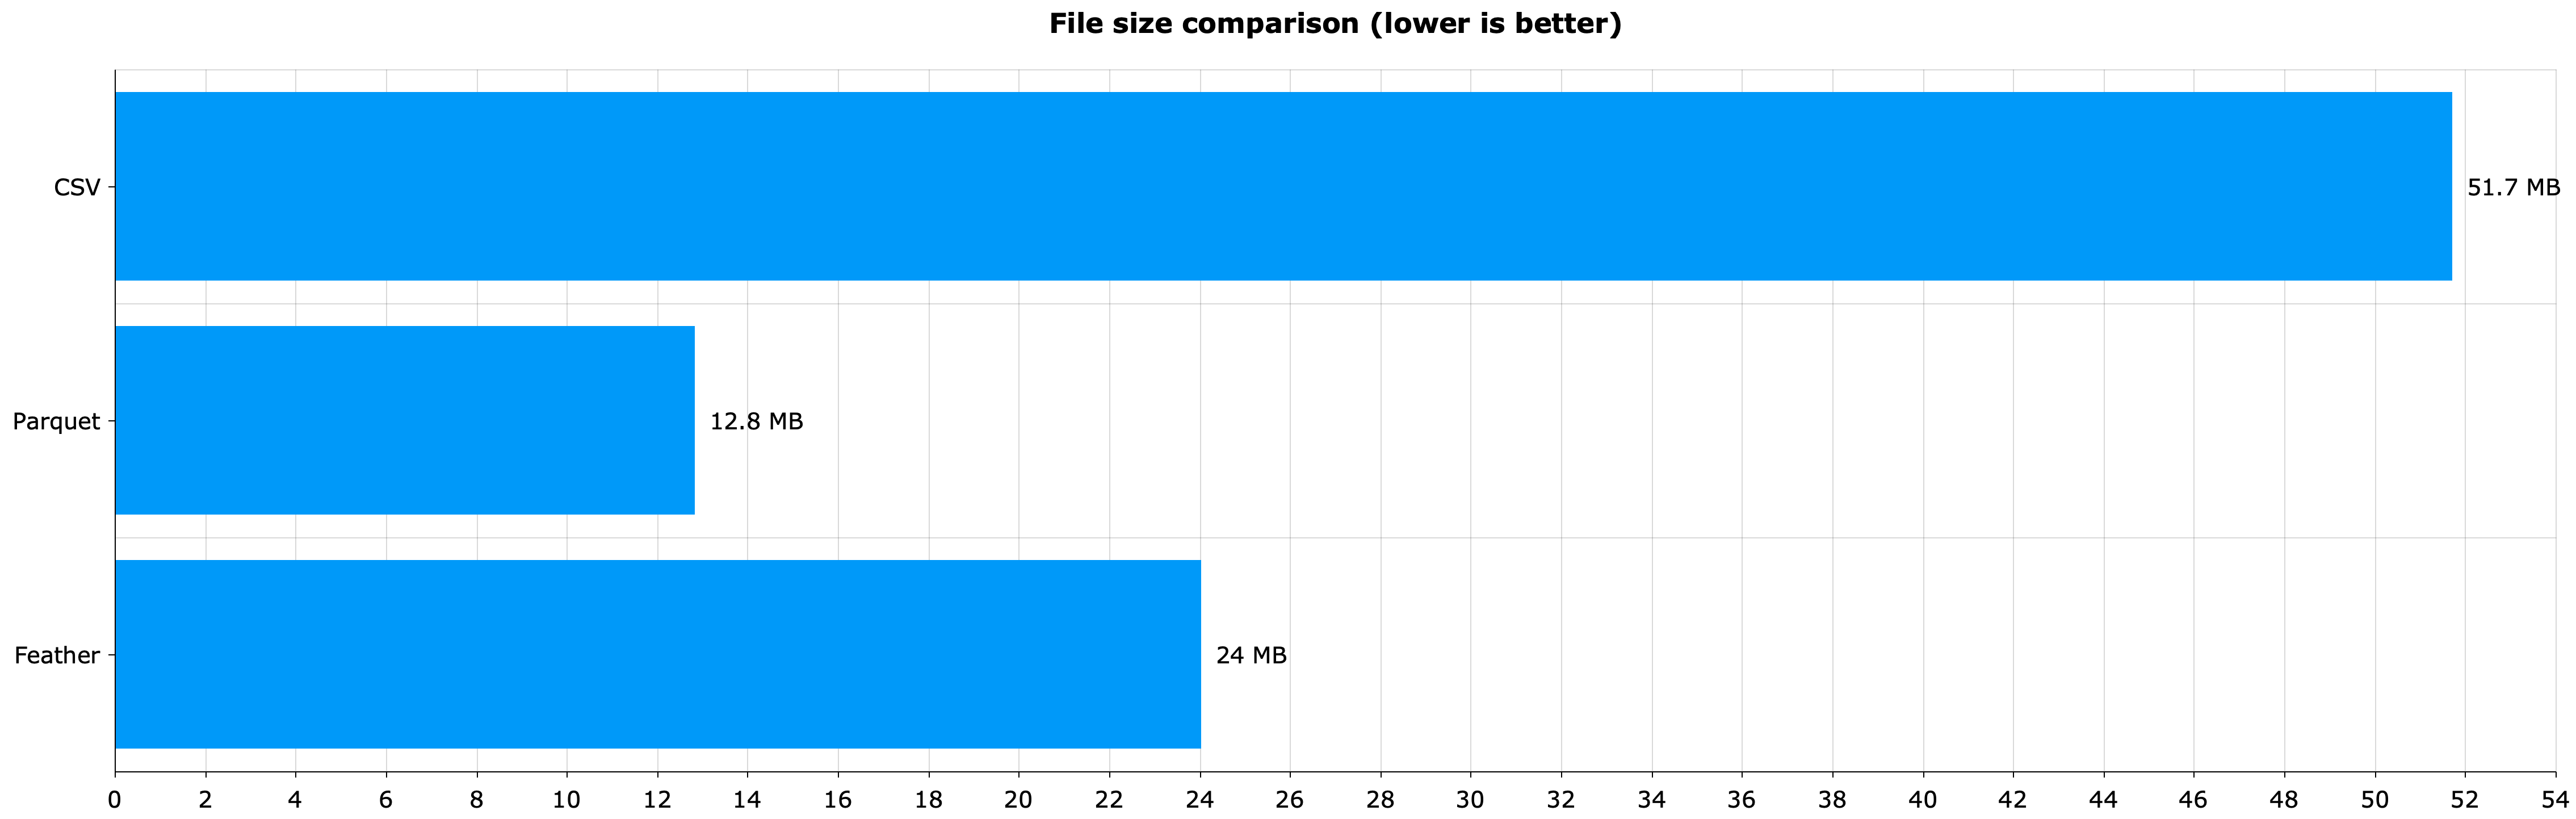
Image 7 – CSV vs. Parquet vs. Feather file size (CSV: 51.7 MB; Parquet: 12.8 MB; Feather: 24 MB)
Parquet is 4x smaller on disk when comparing a relatively small dataset. Scale that to hundreds of gigabytes of data and take it to the cloud — your wallet will be forever thankful.
Apache Arrow in R Shiny — How to Speed Up Your Dashboards
The question now remains — how the heck do I implement Apache Arrow in my R Shiny dashboards? That’s what this section will demystify.
We’ll need a dashboard to start, so let’s create one quickly based on the NYSE prices dataset. The dashboard will allow you to select a ticker and view the first 15 rows of data in a table. You’ll be able to pick between the first 250 tickers, as leaving all of them would likely crash the app.
Speed up your Shiny dashboard with updateInput, CSS, JavaScript, and more.
It’s a simple dashboard indeed, and you can create it with the following source code:
Here’s how it looks like:
Image 8 – Default R Shiny dashboard
And here’s the source code for the dashboard that uses Apache Arrow:
In a nutshell, you’ll have to import an additional library and use a different function to read the data. You can still read it from a CSV file, but the example below leverages the advantages of Parquet. Finally, you’ll have to call the collect() function before displaying the table.
And that’s it! Here’s how this version of the dashboard looks like:

Image 9 – R Shiny dashboard that uses Apache Arrow
Only the date column has changed. It’s now displayed as a timestamp, but that’s an easy fix. We’ll leave it up to you.
Conclusion
And there you have it — a bulletproof guide on using Apache Arrow in R and R Shiny. You’ve learned a lot, from the basic difference of row and columnar storage, reasons why Parquet and Feather files are better if you care for speed and disk space, to a fully working dashboard built on the Apache Arrow package.
How strong is your Shiny App UX? Follow Appsilon’s 7 steps to design dashboards that people love.
The further you scale, the more benefits of Apache Arrow you’ll see. Parquet or Feather should be your go-to data format if you don’t plan to edit data on the fly. A comparison with CSV looks unreal, to say the least.
Have you implemented Apache Arrow in your projects? Did you find the transition easy? Please let us know, and subscribe to our newsletter for more stories like this.
Contact Us
