Share
Share Tweet
Tweet Share
Share

I have never been a fan of pie charts. My two biggest issues with a pie chart are that:
- They often are “the lazy option” in data visualization, signaling not much thought has been put by the designer into what story the data is actually telling.
- People are notoriously bad at comparing areas when compared with interval lengths (this phenomenon, when combined with the issues of the commonly used map projections leads to the surprising underestimation of the perceived size of Africa, as can be seen in this great visualization by Kai Krause
Need to improve your data visualization skills? Explore these 5 key data visualization principles.
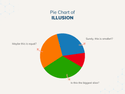
If you are not sure, here is a quick test I created for an internal discussion at Appsilon:
Which of the slices is the largest in the pie chart?
What do you think? Can you order the parts by their size?
When I showed this pie chart to a group of people ~60% of them misjudged which of the parts is the largest, even though many of them work with data and various visualizations of it on a daily basis.
Disclaimer
Of course, this example is not a concluding argument, and this blog post is not a scientific study of human perception.
It is, however, a warning sign.
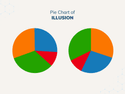
Don’t trust the pie charts – you will read them differently depending on how they are rotated. To demonstrate it, let’s look at the above chart rotated by two different angles:
On the left-hand side, it’s clear that the orange part is larger than the blue. But it’s hard to compare the orange and the green. On the right-hand side, it’s clear that the green part is larger than the orange.
The fact that the perception of the relative sizes of the parts depends so strongly on the orientation of the same chart is surprising. One would expect rotating a circle shouldn’t make a difference.
Bar chart vs pie chart
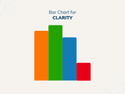
Almost always, a bar chart is easier to interpret than a pie chart. Here is the same data as above, shown on a bar chart:
Note, that on this bar chart it’s obvious what the order is.
Additionally, even though there are no scales or grids provided, it’s clear that the orange part is closer to the green in size than the blue. This information is almost impossible to read from the pie chart.
For best results, stick to data visualization best practices. Learn and apply data visualization best practices for bar plots.
Pitfalls of bar charts
Of course, bar charts can also be somewhat misleading.
For example, when looking at bar charts we often assume meaning in the order of the bars. And while sometimes there is meaning in the order, (e.g., when using a bar chart on time-series data) there often isn’t any at all (like in the above example). But that doesn’t stop the viewer from interpreting it as such.
The order may also skew the overall perception of the results as being positive if the bars are ordered in ascending manner or negative if in descending order.
Tips for when you absolutely must use a pie chart
Sometimes in the practice of a data scientist, you are forced to use a pie chart. Say for example, in an external requirement. When it’s a must consider the following:
- It’s worth explaining to the decision-maker the pitfalls of using pie charts (even asking them to run the quiz from this post can help!)
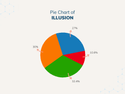
- A pie chart can be made less misleading by adding the values on top of the parts. This way, when in doubt, a user can compare values. This solution is not ideal, as it rests on additional action of the user while the first, possibly erroneous, impression has already been made.
Summing up why you shouldn’t use pie charts
So did you guess correctly that the largest part of the first pie chart (and each one that followed) was green? Was it obvious?
Need to share business insights with decision-makers? See which BI tools are best for your use case.
Of course, missing tiny differences can happen, but please note that the green slice is actually larger than the orange slice by 8%. And the orange slice is larger than the blue slice by 11%.
If it wasn’t obvious to you, then can you really expect other viewers to interpret it differently? Don’t leave interpretations of your data up to chance. Pick a more appropriate data visualization for your needs; choose the right tool for the job.
Contact Us

Head of AI

Get Updates
Subscribe to Shiny Weekly Newsletter
Join 4000+ Shiny enthusiasts to see the latest Shiny news from the R community.