{rhino} vs {golem} vs {leprechaun}: Which R/Shiny Library is Right for You?
Discover the best R/Shiny library for your data visualisation needs. Compare Rhino, Golem, and Leprechaun in our in-depth analysis to find the right fit for your project.
Join the Shiny Community every month at Shiny Gatherings
Discover the best R/Shiny library for your data visualisation needs. Compare Rhino, Golem, and Leprechaun in our in-depth analysis to find the right fit for your project.
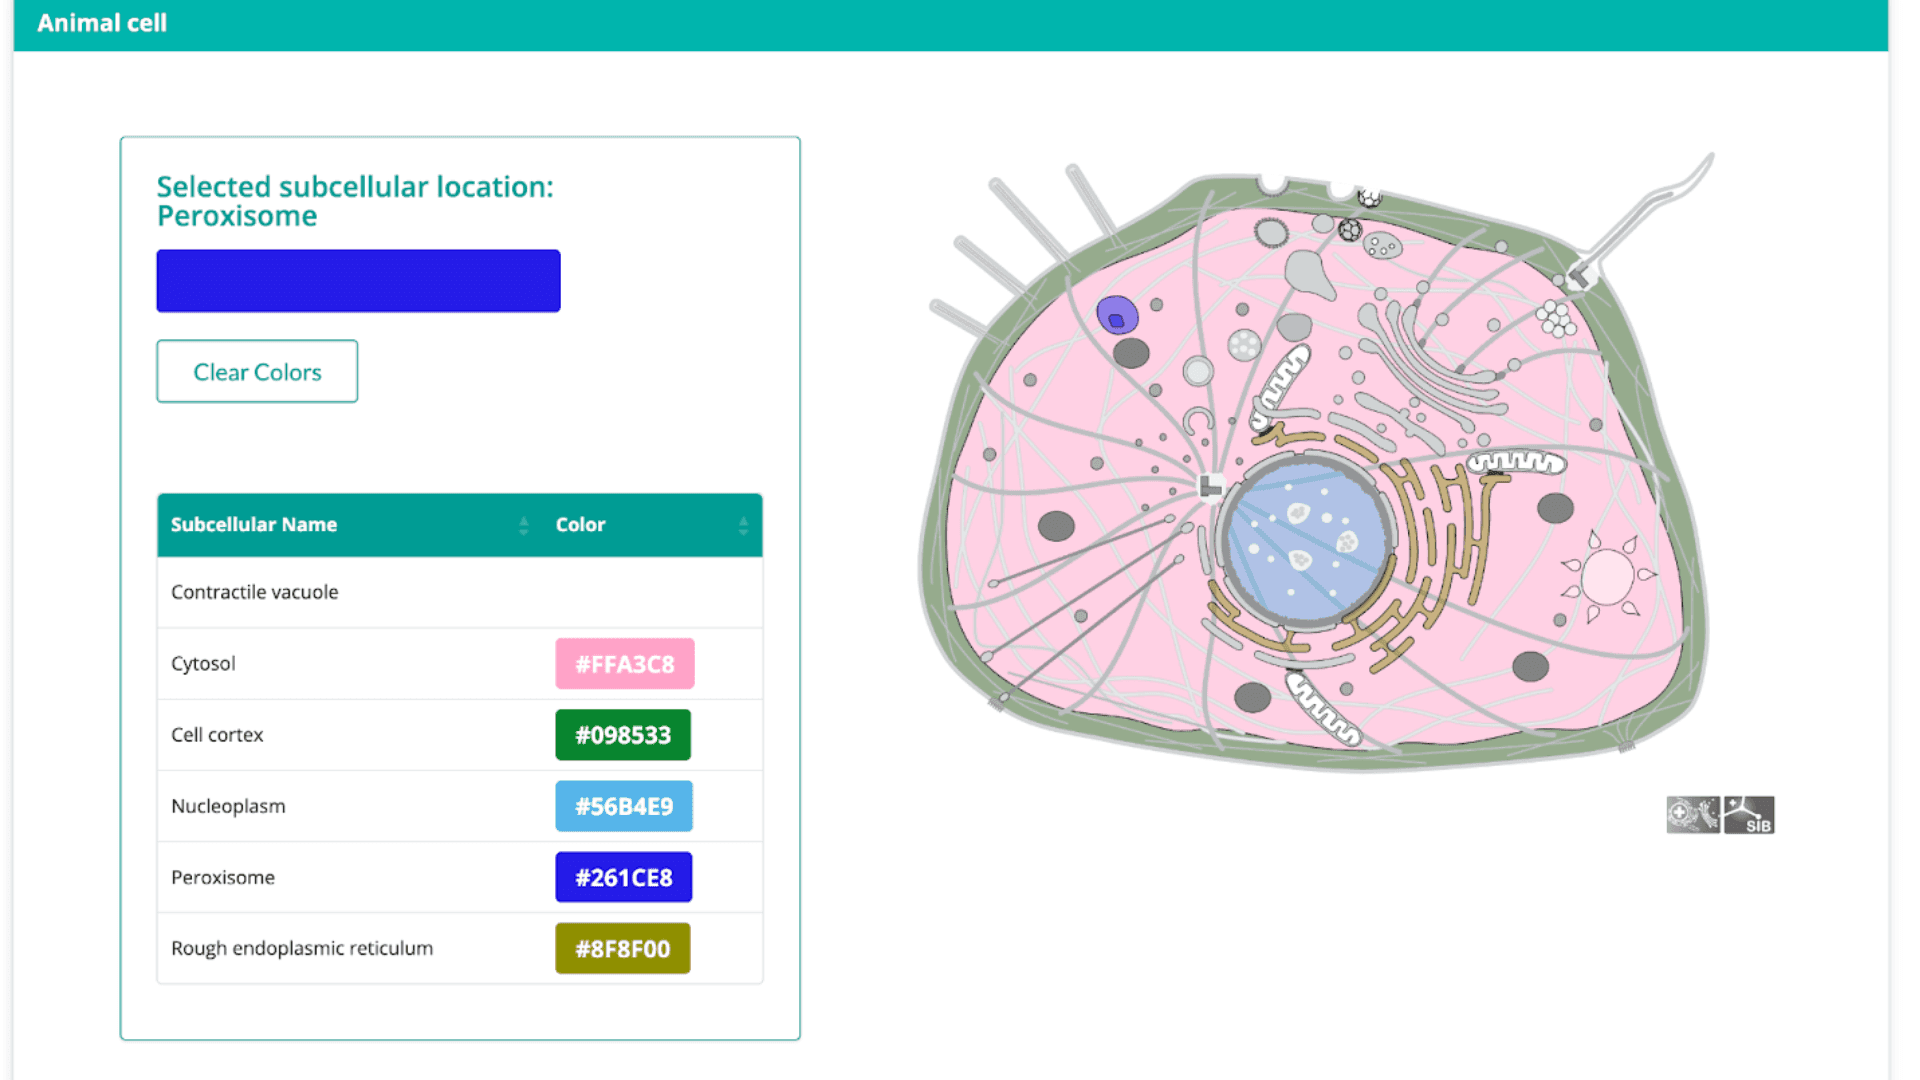
Drawing cells and highlight internal components with ease using the {drawCell} R package.
Plotting GPX files is easy with R - Learn how to Visualize GPX files with R in minutes.
If you're looking to switch data analytics tooling - now is the time. R and Shiny are rising in popularity as data science teams see more value in R programming.


