Share
Share Tweet
Tweet Share
Share


reactable.extras 0.2.0 Release: Enhanced Interactivity and Efficiency for Shiny Apps

24 November 2023
We are thrilled to announce the release of reactable.extras, which is now available for seamless integration into your Shiny applications, marking its debut as a significant release on CRAN.
With reactable.extras, you can elevate your data tables to new heights, simplifying the management of interactive components within reactable tables, offering even more enhanced functionality and a smoother user experience.
Table of Contents
- Why Choose
reactable.extras? - Installing the Package
- Server-Side Processing
- Custom Inputs
- Explore More Open-Source Tools for Your Shiny Projects
Why Choose reactable.extras?
reactable is known for creating interactive, feature-rich tables in Shiny applications. With reactable.extras, you can take your reactable tables to the next level by adding custom inputs, server-side rendering and more:
Custom Inputs: reactable.extras incorporate custom inputs within reactable data tables. Supported input types include text input, buttons, dropdowns, dates, and checkboxes. You can now create interactive data tables that respond to user inputs with ease.
Server-side processing: reactable.extras renders only a subset of large data in the server memory. This almost instantly renders the desired page and keeps the amount of memory used in the browser minimal.
Installing the Package
- Install the
reactable.extraspackage:
install.packages(“reactable.extras”)
- After installation, you can simply load
reactable.extras:
library(reactable.extras)
Server-Side Processing
Rendering a reactable with a lot of data can be inefficient. The initial loading will take some time, and a lot of memory will be thrown into the browser.
A more efficient approach is to render only the data that is needed to be displayed on a single page of a table.
reactable_extras_ui() and reactable_extras_server() is a wrapper for reactable::reactableOutput() and reactable::renderReactable({reactable(...)}).
It renders only a subset of large data in the server memory. This almost instantly renders the desired page and keeps the amount of memory used in the browser minimal.
Consider this example data:
library(shiny)
library(reactable)
library(reactable.extras)


mtcars_ultra <- purrr::map(
  seq(1L, 20000L, by = 1L),
  ~ {
    temp_df <- mtcars
    temp_df$make <- rownames(temp_df)
    rownames(temp_df) <- NULL
    temp_df <- dplyr::mutate(temp_df, id_row = paste0("id_", dplyr::row_number(), "_", .x)) temp_df }, .progress = TRUE ) |>
  purrr::list_rbind()
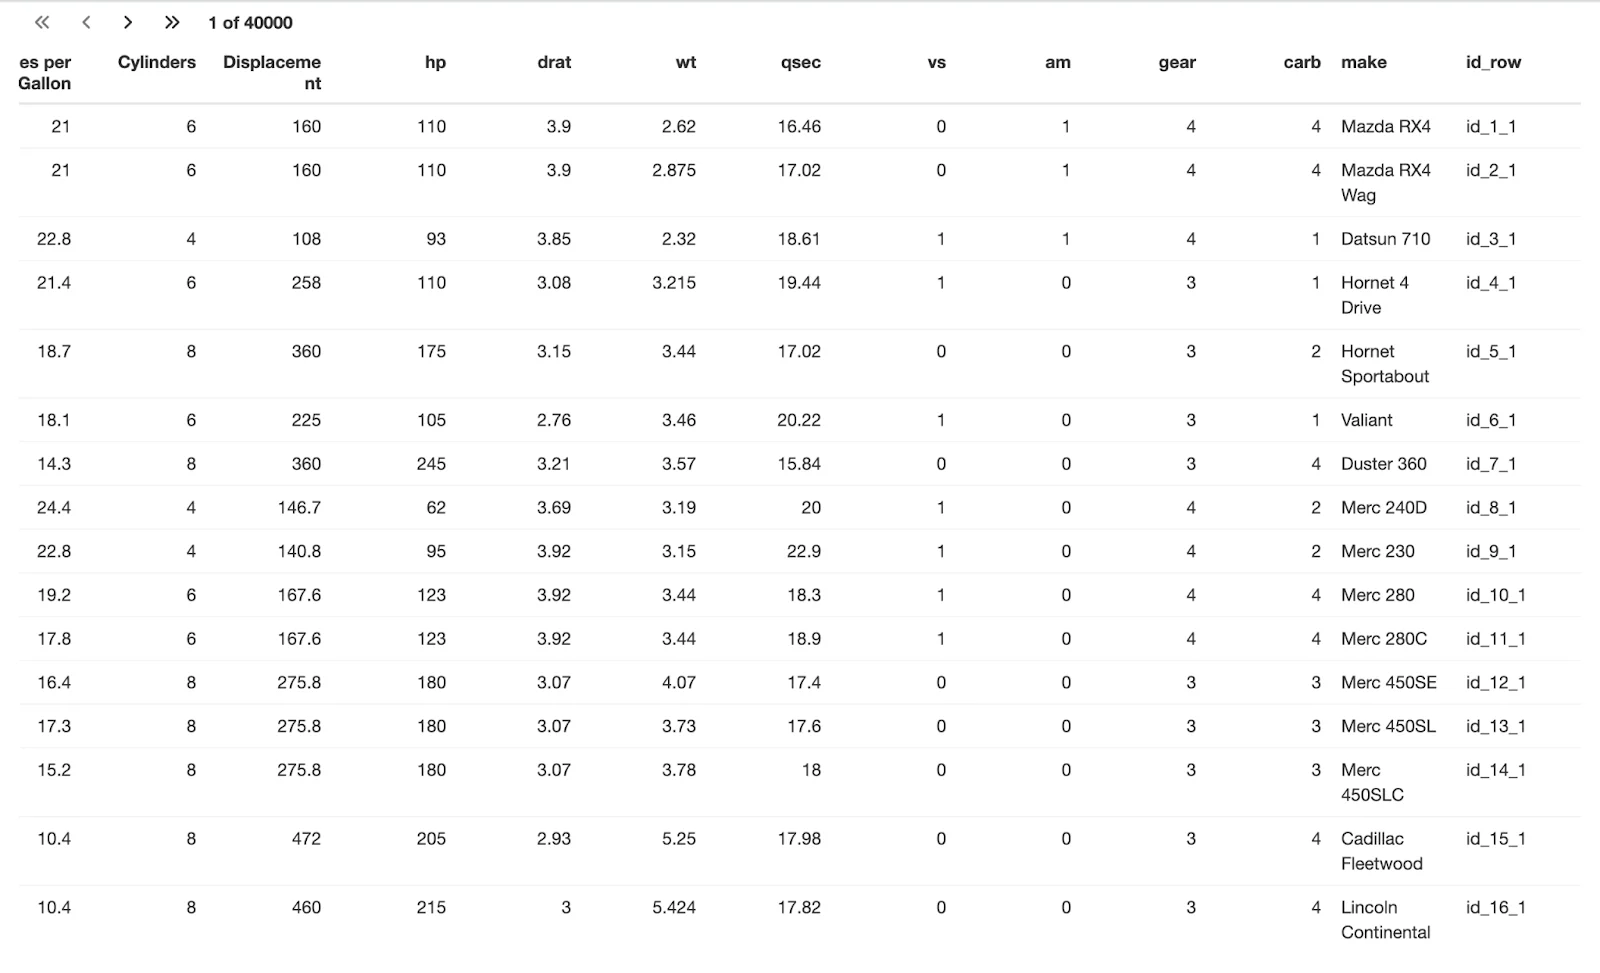
Sample Data: Automotive Specifications Table
And compare the difference in initial load time and amount of memory used in the browser when loading all the data at once vs loading only the data needed for the page.
App 1 (Rendering All Data at Once)
Full Data Rendered
We’ll create a simple interactive table to show the dataset mtcars_ultra. This table will have three columns labelled “Miles per Gallon”, “Cylinders”, and “Displacement”. This table will show only 16 rows of data at a time, however, it will try to load all the data at once, which could slow down the webpage.
# All of the data rendered all at once
shinyApp(
  ui = reactableOutput("test"),
  server = function(input, output) {
    output$test <- renderReactable({
      reactable(
        data = mtcars_ultra,
        columns = list(
          mpg = colDef(name = "Miles per Gallon"),
          cyl = colDef(name = "Cylinders"),
          disp = colDef(name = "Displacement")
        ),
        defaultPageSize = 16
      )
    })
  }
)
App 2 (Server-Side Processing)
Server Side Processing
Here we’re creating the same table, however, this one is smarter with large datasets such as mtcars_ultra. Instead of loading all the data at once, it only loads a portion of the data that’s needed for the current page view. This makes it quicker and more memory-efficient as it’s set up to handle a large number of pages efficiently with reactable_extras.
# Only the subset of the data needed for the page is rendered
shinyApp(
  ui = reactable_extras_ui("test"),
  server = function(input, output, session) {
    reactable_extras_server(
      "test",
      data = mtcars_ultra,
      columns = list(
        mpg = colDef(name = "Miles per Gallon"),
        cyl = colDef(name = "Cylinders"),
        disp = colDef(name = "Displacement")
      ),
      total_pages = 4e4
    )
  }
)
Custom Inputs
You can use custom inputs inside your reactable column. Custom inputs can significantly enhance the interactivity and functionality of tables in your web applications. For instance, there may be scenarios where you need to allow users to edit values directly within a table, toggle settings, or make selections via dropdown menus without leaving the context of the data they’re working with. reactable.extras offers a seamless way to integrate these interactive elements directly into your reactable tables.
Supported types for now:
- text input: text_extra
- button: button_extra
- dropdown: dropdown_extra
- date: date_extra
- checkbox: checkbox_extra
- tooltips: tooltip_extra
It’s possible to apply additional styling to your inputs by passing the class argument:
checkbox_extra("check", class = "checkbox-extra")
With Styling
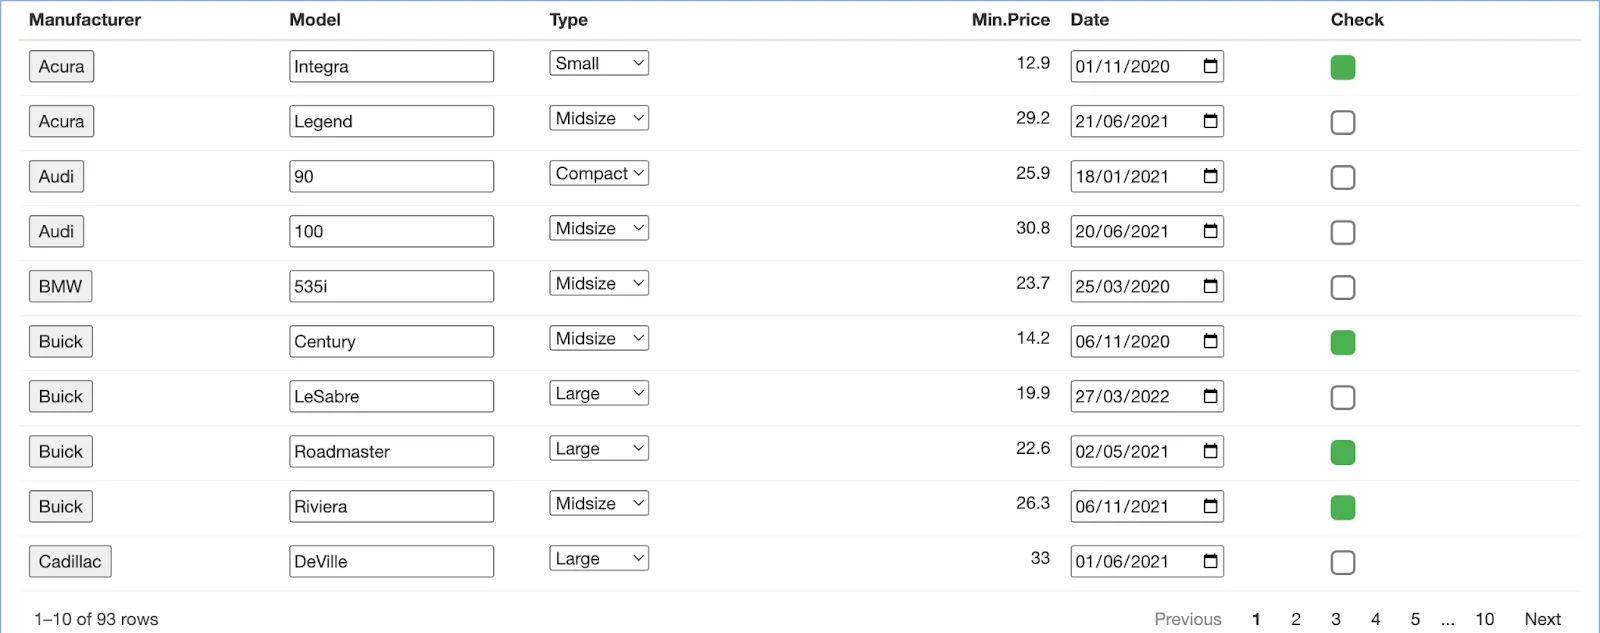
Car Inventory Checklist with Pricing and Dates
/* Default style for checkboxes */
.checkbox-extra {
    width: 20px;
    height: 20px;
    border: 2px solid grey; /* Grey border */
    border-radius: 5px;
    appearance: none; /* Remove default checkbox style */
    background-color: white; /* White background */
}

/* Style when checkbox is checked */
.checkbox-extra:checked {
    background-color: #4CAF50; /* Green background */
    border-color: #4CAF50; /* Green border */
}
Remember to correctly link the CSS file in your Shiny app:
ui <- fluidPage(
    tags$head(
        tags$link(rel = "stylesheet", type = "text/css", href = "custom_styles.css")
    ),
    # ... rest of your UI elements ...
)
Without Styling

Car Inventory Data Table with Selection Checkmarks
Also, it’s important to import JavaScript dependencies by adding to UI:
reactable.extras::reactable_extras_dependency()
All events of your inputs will be tracked and can be used in your shiny server.
Example application:
library(shiny)
library(reactable)
library(reactable.extras)

# Preparing the test data
df <- MASS::Cars93[, 1:4]
df$Date <- sample(
 seq(as.Date("2020/01/01"), as.Date("2023/01/01"), by = "day"),
  nrow(df)
)
df$Check <- sample(c(TRUE, FALSE), nrow(df), TRUE)

# Helper function for string formatting
string_list <- function(values) {
  paste0("{", paste0(names(values), " : ", unlist(values), collapse = ", "), "}")
}

# Shiny app
shinyApp(
  ui = fluidPage(
    reactable_extras_dependency(),
    reactableOutput("react"),
    hr(),
    textOutput("date_text"),
    textOutput("button_text"),
    textOutput("check_text"),
    textOutput("dropdown_text"),
    textOutput("text")
  ),
  server = function(input, output) {
    output$react <- renderReactable({
      reactable(
        df,
        columns = list(
          Manufacturer = colDef(cell = button_extra(id = "button", class = "button-extra")),
          Check = colDef(cell = checkbox_extra(id = "check", class = "checkbox-extra"), align = "left"),
          Date = colDef(cell = date_extra(id = "date", class = "date-extra")),
          Type = colDef(cell = dropdown_extra(id = "dropdown", unique(df$Type), class = "dropdown-extra")),
          Model = colDef(cell = text_extra(id = "text"))
        )
      )
    })

    # Render text outputs
    output_text_render <- function(id) {
      output[[id]] <- renderText({
        req(input[[id]])
        paste0(id, ": ", string_list(input[[id]]))
      })
    }

    lapply(c("date_text", "button_text", "check_text", "dropdown_text", "text"), output_text_render)
  }
)
You can also use tippy to add tooltips to your reactable columns:
We have implemented tooltips in our application using Tippy.js, a JavaScript library designed for creating interactive and customizable tooltips.
For example, let’s build an interactive table displaying car data. We will utilize the reactable.extras package and tippy to add tooltips to table headers. When users hover over headers like “Manufacturer” or “Check,” tooltips provide additional context, such as “Manufacturer type” or “Checkbox.”
This enhances the app’s interactivity and user experience as it offers more information directly to the UI without cluttering the view.
library(shiny)
library(reactable)
library(reactable.extras)

df <- MASS::Cars93[, 1:4]
df$Date <- sample(seq(as.Date("2020/01/01"), as.Date("2023/01/01"), by = "day"), nrow(df))
df$Check <- sample(c(TRUE, FALSE), nrow(df), TRUE)

shinyApp(
  ui = fluidPage(
    reactable_extras_dependency(),
    reactable_extras_ui("table"),
    hr(),
    textOutput("date_text"),
    textOutput("button_text"),
    textOutput("check_text"),
    textOutput("dropdown_text"),
    textOutput("text")
  ),
  server = function(input, output) {
    reactable_extras_server(
      "table",
      data = df,
      columns = list(
        Manufacturer = colDef(
          header = tooltip_extra(content = "Manufacturer type"),
          cell = button_extra("button")
        ),
        Check = colDef(
          header = tooltip_extra(content = "Checkbox"),
          cell = checkbox_extra("check"),
          align = "left"
        ),
        Date = colDef(
          header = tooltip_extra(content = "Date input"),
          cell = date_extra("date")
        ),
        Type = colDef(
          header = tooltip_extra(content = "Type dropdown"),
          cell = dropdown_extra("dropdown", unique(df$Type))
        ),
        Model = colDef(
          header = tooltip_extra(content = "Model input"),
          cell = text_extra("text")
        )
      )
    )
  }
)
Combine reactable functionalities
Let’s build a Shiny app that leverages the reactable and reactable.extras packages to present an interactive table that allows users to filter, search, and select multiple rows within a dataset of 1000 entries.
Each entry has an ID, SKU number, action status, and registration date. Custom buttons are integrated into the ‘Actions’ column, and a date input is provided for the ‘Registered’ column for enhanced interactivity.
Additionally, the UI includes buttons for users to select specific rows, clear selections, and navigate directly to the third page of the table. The server logic handles these interactive features by observing button clicks and updating the table accordingly, allowing for a dynamic user experience.
library(shiny)
library(reactable)
library(reactable.extras)


data <- data.frame(
  ID = 1:1000,
  SKU_Number = paste0("SKU ", 1:1000),
  Actions = rep(c("Updated", "Initialized"), times = 20),
  Registered = as.Date("2023/1/1")
)


ui <- fluidPage(
  # Include reactable.extras in your UI
  reactable_extras_dependency(),
  actionButton("select_btn", "Select rows"),
  actionButton("clear_btn", "Clear selection"),
  actionButton("page_btn", "Change to page 3"),
  reactableOutput("table")
)


server <- function(input, output, session) {
  output$table <- renderReactable({
    # Create a reactable table with enhanced features
    reactable(
      data,
      filterable = TRUE,
      searchable = TRUE,
      selection = "multiple",
      columns = list(
        ID = colDef(name = "ID"),
        SKU_Number = colDef(name = "SKU_Number"),
        Actions = colDef(
          name = "Actions",
          cell = button_extra("button", class = "btn btn-primary")
        ),
        Registered = colDef(
          cell = date_extra("Registered", class = "date-extra")
        )
      )
    )
  })

  observeEvent(input$select_btn, {
    # Select rows
    updateReactable("table", selected = c(1, 3, 5))
  })

  observeEvent(input$clear_btn, {
    # Clear row selection
    updateReactable("table", selected = NA)
  })

  observeEvent(input$page_btn, {
    # Change current page
    updateReactable("table", page = 3)
  })

}


shinyApp(ui, server)
Explore More Open-Source Tools for Your Shiny Projects
reactables.extras provides an improved user satisfaction for customer-facing apps, optimizes the handling of large datasets with reduced strain on client-side resources and serves as a cost-effective solution (reduced server load and optimized memory usage).
Be sure to head over to the Rhinoverse to explore more open-source tools for your Shiny project. You can find more resources like tutorials and documentation on reactable.extras in Shiny on the reactable.extras page.
If you find value in these open-source packages, be sure to give them a star on GitHub. That lets us know we’re on the right path toward serving you and the fellow R Shiny community. And, of course, if you have feedback or need assistance getting started, reach out!
Contact Us

Head of Sales

Get Updates
Subscribe to Shiny Weekly Newsletter
Join 4000+ Shiny enthusiasts to see the latest Shiny news from the R community.