


 Share
Share Tweet
Tweet Share
Share


[UPDATE – December 2020] – Due to the large interest in satellite imagery analysis, we decided to write a FAQ article answering your top questions. You can read it here.
By Marek Rogala and Jędrzej Świeżewski, PhD
In this article, we focus on the technical aspects of the machine learning solution that we implemented for the xView2 competition. We created ML models to assess structural damage by analyzing satellite images taken before and after natural disasters. We used PyTorch to build our models and fast.ai to develop their critical parts. Test out our solution here.
Introduction
The Appsilon Machine Learning team recently took part in the xView2 competition organized by the Defense Innovation Unit (United States Department of Defense). Participants set out to utilize satellite imagery data to assist humanitarian efforts during natural disasters. We were asked to build ML models using the novel xBD dataset provided by the organizers to estimate the damage to infrastructure with the goal of reducing the amount of human labor and time required to plan an appropriate response. You can read more about the details of the competition and the dataset in our previous blog post on the topic.
The models we submitted achieve high accuracy – 0.83792 for localization, 0.65355 for damage, and 0.70886 overall. Whilst some competitors submitted even more accurate models, we believe that for the model to be useful it must have an interface that enables everyone to leverage its capabilities. Therefore, we developed an intuitive user interface and implemented it in Shiny using our own shiny.semantic open-source package.
In this article, we focus on the technical aspects of our solution and share our experiences in building machine learning models that are able to accurately localize buildings and assess their damage. We used PyTorch to build our models and fast.ai to develop their critical parts. This remarkable library allows for rapid experimentation and utilization of the latest technical developments in the field of Computer Vision.
The Damage Assessment App
We implemented our models within a Shiny app that allows the user to explore the impact of several real-world natural disasters by running our model on built-in scenarios such as Hurricane Florence and the Santa Rosa Wildfire.
One of the scenarios, the September 2018 earthquake in Indonesia, caused a major tsunami that reached the provincial capital of Palu. This caused significant property damage in the area:
The Data
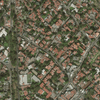
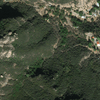
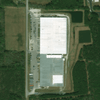
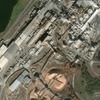
The task required us to build our model using satellite imagery data for a number of regions that have recently experienced natural disasters. The dataset was very diverse with affected locations ranging from remote, forested areas, through industrial districts with large buildings to dense urban areas.
Diverse locations and building sizes are a challenge when building computer vision models.
Another complicating factor was the number of different types of disasters – aside from localizing the buildings, the model must also be able to assess damage to structures. That requires a different approach depending on whether the area was destroyed by a fire or a flood. There was a number of different disaster types represented in the dataset including:
| Volcanic eruptions (pre and post) | Hurricanes (pre and post) |
| Disastrous floods (pre and post) | Tsunamis (pre and post) |
| Raging wildfires (pre and post) | Tornado damage (pre and post) |
| Bushfires (pre and post) | |
Why use satellite imagery?
The applications of satellite imagery are proliferating as the data itself improves – we are gaining access to more frequent and accurate snapshots of the earth’s surface. These data have a number of intrinsic benefits. Aside from frequency, retrievability of historical images, and their increasingly high level of quality, researchers, and practitioners utilize the fact that satellite images expand into other parts of the electromagnetic spectrum. This opens new opportunities for analysis unavailable to the human eye. Some satellites offer as many as 12 different channels of information, including not only visible light but, for example, also infrared signals – we covered in one of our previous blog posts how to acquire such data.
At Appsilon we have utilized satellite imagery for a number of commercial projects, but this was our first venture into applying this expertise to humanitarian aid. The project leveraged a unique feature of satellite data: availability of both historical images of a given area and new images that represent the most recent conditions. These are critical for assisting humanitarian response – the damage assessment must be conducted as quickly as possible to develop an appropriate plan of remedial action and any new developments must be accounted for. Relieving response planners from the burden of sifting through thousands of images or conducting in-person surveys allows for focusing the scarce resources on the actual service delivery.
Overall, utilization of satellite imagery-based AI tools results in a significant reduction in time required to take appropriate action and enables the response effort to save more lives.
The conclusion of the xView2 competition in January 2020 overlapped with the most dire period during the Australian wildfires – the models developed during the challenge were quickly deployed as open-source solutions to assist damage assessment and recovery efforts.
The machine learning pipeline
Developing an accurate ML model for satellite imagery analysis comprises two tasks: building localization and building damage assessment. While this can be done with a single model, we decided to build a separate model for each of these tasks. Given the time pressure, we also reused parts of code from the official baseline model, including the code for generating final masks for submission from predictions. We implemented the models in PyTorch and used the fast.ai wrapper for the damage classification task.
This approach has a few pitfalls related to the fact that each model requires a separate training dataset with the same preprocessing schedule. Preprocessing entails introducing changes to color histograms of the images, as well as cropping, padding, flipping, and other data augmentation methods. Therefore, we quickly ran into the challenge of managing a large number of moving parts. At one point during the competition, we submitted a solution where we performed inference on slightly different parameters than the parameters used for model training resulting, not surprisingly, in a very low score.
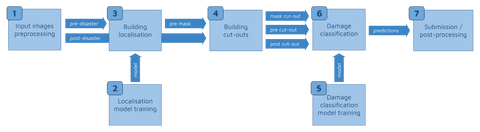
To prevent this from happening again, we employed an appropriate ML pipeline so that our training process is fully reproducible whilst remaining efficient. We achieved this by basing the pipeline on our internal framework. It memorized the results of all the steps allowing us to reuse them, and it automatically ran the computation if any of the hyperparameters or dependencies changed. This made our development process much faster, whilst safeguarding us from making mistakes. The specific steps were:
- Input images preprocessing (e.g., image augmentation)
- Localization model training
- Building localization (inference from the model)
- Building cut-outs
- Damage classification model training
- Damage classification (inference from the model)
- Submission / post-processing
An appropriate ML pipeline not only ensures a robust, error-free development process, it also enhances the reproducibility of the solution. It is much easier to understand the resulting model if we understand the details of the steps taken during its development.
Technical takeaways
The ML pipeline proved critical when working with two stacked models (localization and damage assessment). We would also like to share two other techniques, which enabled us to deliver an accurate model in a limited timeframe.
Transfer learning for localization
For localization, we have used transfer learning to apply one of the best models developed for a SpaceNet competition to the context of building damage assessment in natural disaster response.
Localization constituted just 30% of the final score in the xView2 competition. However, it greatly affected the final score, because the model can only classify damage to a building if it found this building in the first place. Essentially, the better the localization model, the higher the potential score for damage assessment.
Neural networks based on the UNet architecture are designed for segmentation problems making them suitable for this task. UNet architectures solve segmentation problems by first encoding the image to a smaller resolution representation and then decoding it back to create a segmentation mask. However, the process of developing appropriate weights for the segmentation exercise can be time-consuming.
Fortunately, localization of buildings on images is a well-explored problem and we were able to leverage existing, state-of-the-art ML localization solutions developed through a series of SpaceNet competitions to build our model. Specifically, we set out to use pre-trained weights created by XDXD for one of the top solutions in SpaceNet4, built using a VGG-16 encoder.
UNet is a natural choice for segmentation problems such as building localization in satellite images (example of a UNet architecture by Mehrdad Yazdani – Own work, CC BY-SA 4.0, Creative Commons)
Once we built the model with pre-existing weights we continued training it on the xView2 data. This allowed us to achieve improved accuracy, whilst saving computation time compared to building a model from scratch.
7-channel input for classification
We further expedited the training of the damage assessment model by using the 7th channel for identifying the location of the building in an image.
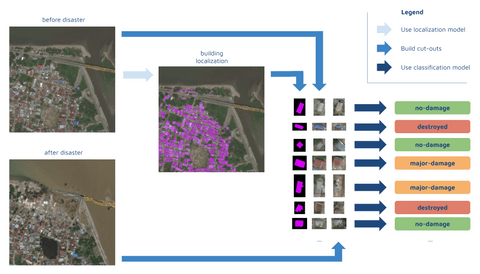
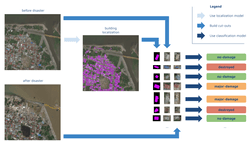
Using the localization model, we were able to identify the locations of individual buildings. We cut each building out of the larger image including a small portion of the surrounding area. The damage score for a given building sometimes depended on its surroundings. For example, a building with an intact roof but fully surrounded by water from a flood was scored to have sustained significant damage. This means we had two cutouts for each building, where its state pre- and post-disaster were depicted (each had 3 channels: RGB).
In addition, we used a 7th channel, a mask highlighting the location of the building in the cutout. The 7th channel allows for quickly identifying the part of the image the classification model should focus on – the building itself. Such an addition increases the size of the model and may slow down the inference process slightly. However, it actually speeds up the training of the model as it learns quicker where to focus its attention, and results in improved accuracy.
Our inference process: The mask helps the model identify buildings and generate cut-outs. Ultimately, it expedites damage classification.
Conclusion
We believe that this is a prime example of how the data science community can contribute to fighting one of the greatest challenges of our time. As part of our Data for Good initiative, we encourage the tech community from around the world to contribute their skills to empower those working at the forefront of natural disaster management and response to make better use of the latest and most advanced solutions.
Make sure to explore our building damage assessment app and follow us for more machine learning and AI for Good content.
Follow Appsilon Data Science
- Follow @Appsilon on Twitter
- Follow Appsilon on LinkedIn
- Try out our R Shiny open source packages
- Sign up for the Data for Good newsletter
- Reach out to our Data For Good Initiative: data4good@wordpress.appsilon.com
Contact Us
Project Manager

Get Updates
Subscribe to Shiny Weekly Newsletter
Join 4000+ Shiny enthusiasts to see the latest Shiny news from the R community.


