


 Share
Share Tweet
Tweet Share
Share


Unraveling the Segment Anything Model (SAM)

20 October 2023
Join the Shiny Community every month at Shiny Gatherings
Analyzing satellite images isn’t exclusively reserved for governments and large corporations. At Appsilon, we’ve spent countless hours working and even writing about analyzing these types of images. As the quality, quantity, and accessibility of satellite images improves, there are more and more satellite image datasets readily available. As a result, interest in satellite imagery analysis (particularly as it relates to deep learning) is at an all-time high.
To address some of the most common questions our team receives, we decided to write an article in an FAQ format. Some of the answers here might surprise you.
Interested in ways to acquire satellite image datasets? Please read our complete guide.
This FAQ addresses the following questions:
The answer to this question is not obvious or intuitive. Taking a picture with a satellite is not at all like taking a picture with a standard camera on the Earth’s surface.
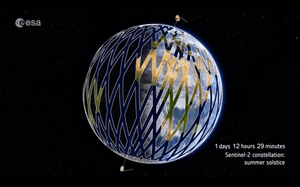
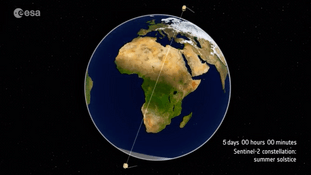
Let’s illustrate with an example. This is the Sentinel-2 mission, which consists of twin satellites (Sentinel 2A and Sentinel 2B). Each satellite orbits the Earth longitudinally while the Earth spins laterally. As you can see in the image below, each satellite takes a “strip” of photos of the Earth’s surface. After five days of collecting these complementary strips, they can capture the whole Earth.
What does this mean in practice? If you choose any specific point on Earth, you will get a new image of that location every 5 to 7 days.
More than 5700 satellites are currently orbiting the Earth. This doesn’t sound like a lot, considering the large size of the Earth and the small size of your average satellite. So, the short answer is no – satellites do not collide. However, they can collide.
Here is a tweet from the European Space Agency after they had to perform a maneuver because two satellites were about to crash. This was a special moment because it was the first time a space agency had to initiate such a maneuver.
This is a common question. We have good news and bad news for people who want to go to Space. The good news is that it is possible to go to the International Space Station. This is fresh news as of June 2019. NASA decided that the space station is open to private citizens if you want to visit.
However, the estimated cost of the ticket is $52M. So, needless to say, the price is prohibitive to most.
.@Space_Station is open for commercial business! Watch @Astro_Christina talk about the steps we’re taking to make our orbiting laboratory accessible to all Americans. pic.twitter.com/xLp2CpMC2x
— NASA (@NASA) June 7, 2019
In general, yes. But let’s start with what shouldn’t be done in R. There are two main categories:
Downloading 100 images and processing them on your computer is very resource-intensive and shouldn’t be done locally in R. There are platforms available that will do the pre-processing and send you small cutouts of the shapefile that you want.
There is Google Earth Engine and Amazon Web Services (AWS), which allow you to query the API. They already have public image sets available, and you can upload your own image sets. All of this is available at your fingertips.
All you need to say is “Google, I want a set of dates for Sentinel images that cover a small square containing Loews Hotel,” and you are set. From there, you choose one or more dates and ask the API to send you already cropped images, reducing the image size by hundreds of kilobytes.
This all happens quite quickly, as you’re using a vast distributed infrastructure to do the calculations. Besides, you can conduct computations there and receive indicators. For example, you can receive the NDVI indicator, which is a simple, mathematical combination of the near-infrared and red channels.
Where does R shine for satellite image analysis? In 3 places:
You can analyze and forecast the indicators that you have built. Operating on small images allows you to leverage many useful R packages to experiment with the data and gain valuable insights. You can also build neural networks that will help you identify objects in the images.
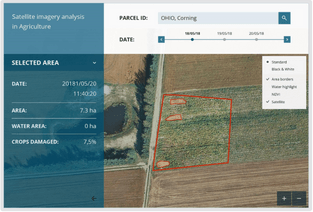
Here is an example of a satellite image analysis dashboard that you can build with R.
By combining publicly available geospatial data for parcel shapefiles, you can draw any parcel on a map and request available dates of images for that parcel. Then you can analyze the image, indicate where crops are destroyed or where they are unhealthy.
Want to see more Shiny Dashboard Examples?
If you need to create powerful, customizable, and interactive satellite imagery dashboards that look great and respond to user input, R Shiny is a clear choice. It requires a bit of coding knowledge even for simple dashboards, but R isn’t a very complicated language. You can quickly get up to speed in a couple of weeks or even a couple of days, depending on your prior knowledge of programming. If you want to make a scalable enterprise Shiny dashboard, then you can always reach out to Appsilon for help. We’re continually pushing the limits of what’s possible with Shiny, and we’d be happy to guide you and your company.

Appsilon is hiring! See our Careers page for new openings.


