


 Share
Share Tweet
Tweet Share
Share


How to Make Your Shiny App Beautiful

01 February 2024
Join the Shiny Community every month at Shiny Gatherings
There’s a more powerful design kid on the block with the name of SASS (Syntactically Awesome Style Sheets), and it simplifies how app styles are written and maintained. Today you’ll learn all about it in the context of Shiny for Python – also a new arrival to the web development scene.
To be more precise, we’ll write a Shiny for Python SCSS dashboard that displays earthquake data, both in table and chart form. The user can filter out quakes below a certain magnitude and can rename the title of the chart. It’s simple but will be enough to demonstrate how SASS and Shiny for Python work.
Want to dive deeper into Shiny for Python capabilities? Here’s an entire demo written by an R Shiny professional.
Table of contents:
To explore SCSS stylings, we have to write the dashboard first. Download the Quakes dataset from Kaggle and create an app.py file.
Regarding the UI user inputs, the app will allow users to filter out the quakes based on the minimum magnitude and change the chart title. The app will display a table of 10 sample rows from the dataset and a histogram showing the distribution of the quake magnitudes.
We won’t dive deep into the code in this article, as the point is to discuss SCSS. Here’s the entire snippet:
import pandas as pd
import matplotlib.pyplot as plt
from IPython import display
from shiny import App, ui, render, reactive
display.set_matplotlib_formats("svg")
plt.rcParams["axes.spines.top"] = False
plt.rcParams["axes.spines.right"] = False


df = pd.read_csv("quake.csv")


app_ui = ui.page_fluid(
    ui.tags.h3("Earthquakes dataset visualizer", class_="app-heading"),
    ui.tags.div(class_="input_container", children=[
        ui.input_slider(
            id="slider_min_magnitude",
            label="Minimum magnitude:",
            min=df["richter"].min(),
            max=df["richter"].max(),
            value=df["richter"].min(),
            step=0.1
        ),
        ui.input_text(
            id="in_histogram_title",
            label="Histogram title",
            value="Distribution of the Richter value"
        )
    ]),
    # Table
    ui.tags.div(class_="card", children=[
        ui.tags.p("Sample of 10 earthquakes", class_="card_title"),
        ui.output_table(id="quake_table", class_="quake_table")
    ]),
    # Histogram
    ui.tags.div(class_="card", children=[
        ui.output_text(id="out_histogram_title"),
        ui.output_plot(id="quake_histogram")
    ])

)


def server(input, output, session):
    @reactive.Calc
    def data():
        return df[df["richter"] >= input.slider_min_magnitude()]

    @output
    @render.table
    def quake_table():
        return data().sample(10, replace=True)

    @output
    @render.text
    def out_histogram_title():
        return input.in_histogram_title()

    @output
    @render.plot
    def quake_histogram():
        fig, ax = plt.subplots()
        ax.hist(data()["richter"], ec="#000000", color="#0099F8")
        return fig


app = App(ui=app_ui, server=server)
You can launch the app by running the following shell command:
shiny run --reload app.pyHere’s what it looks like:
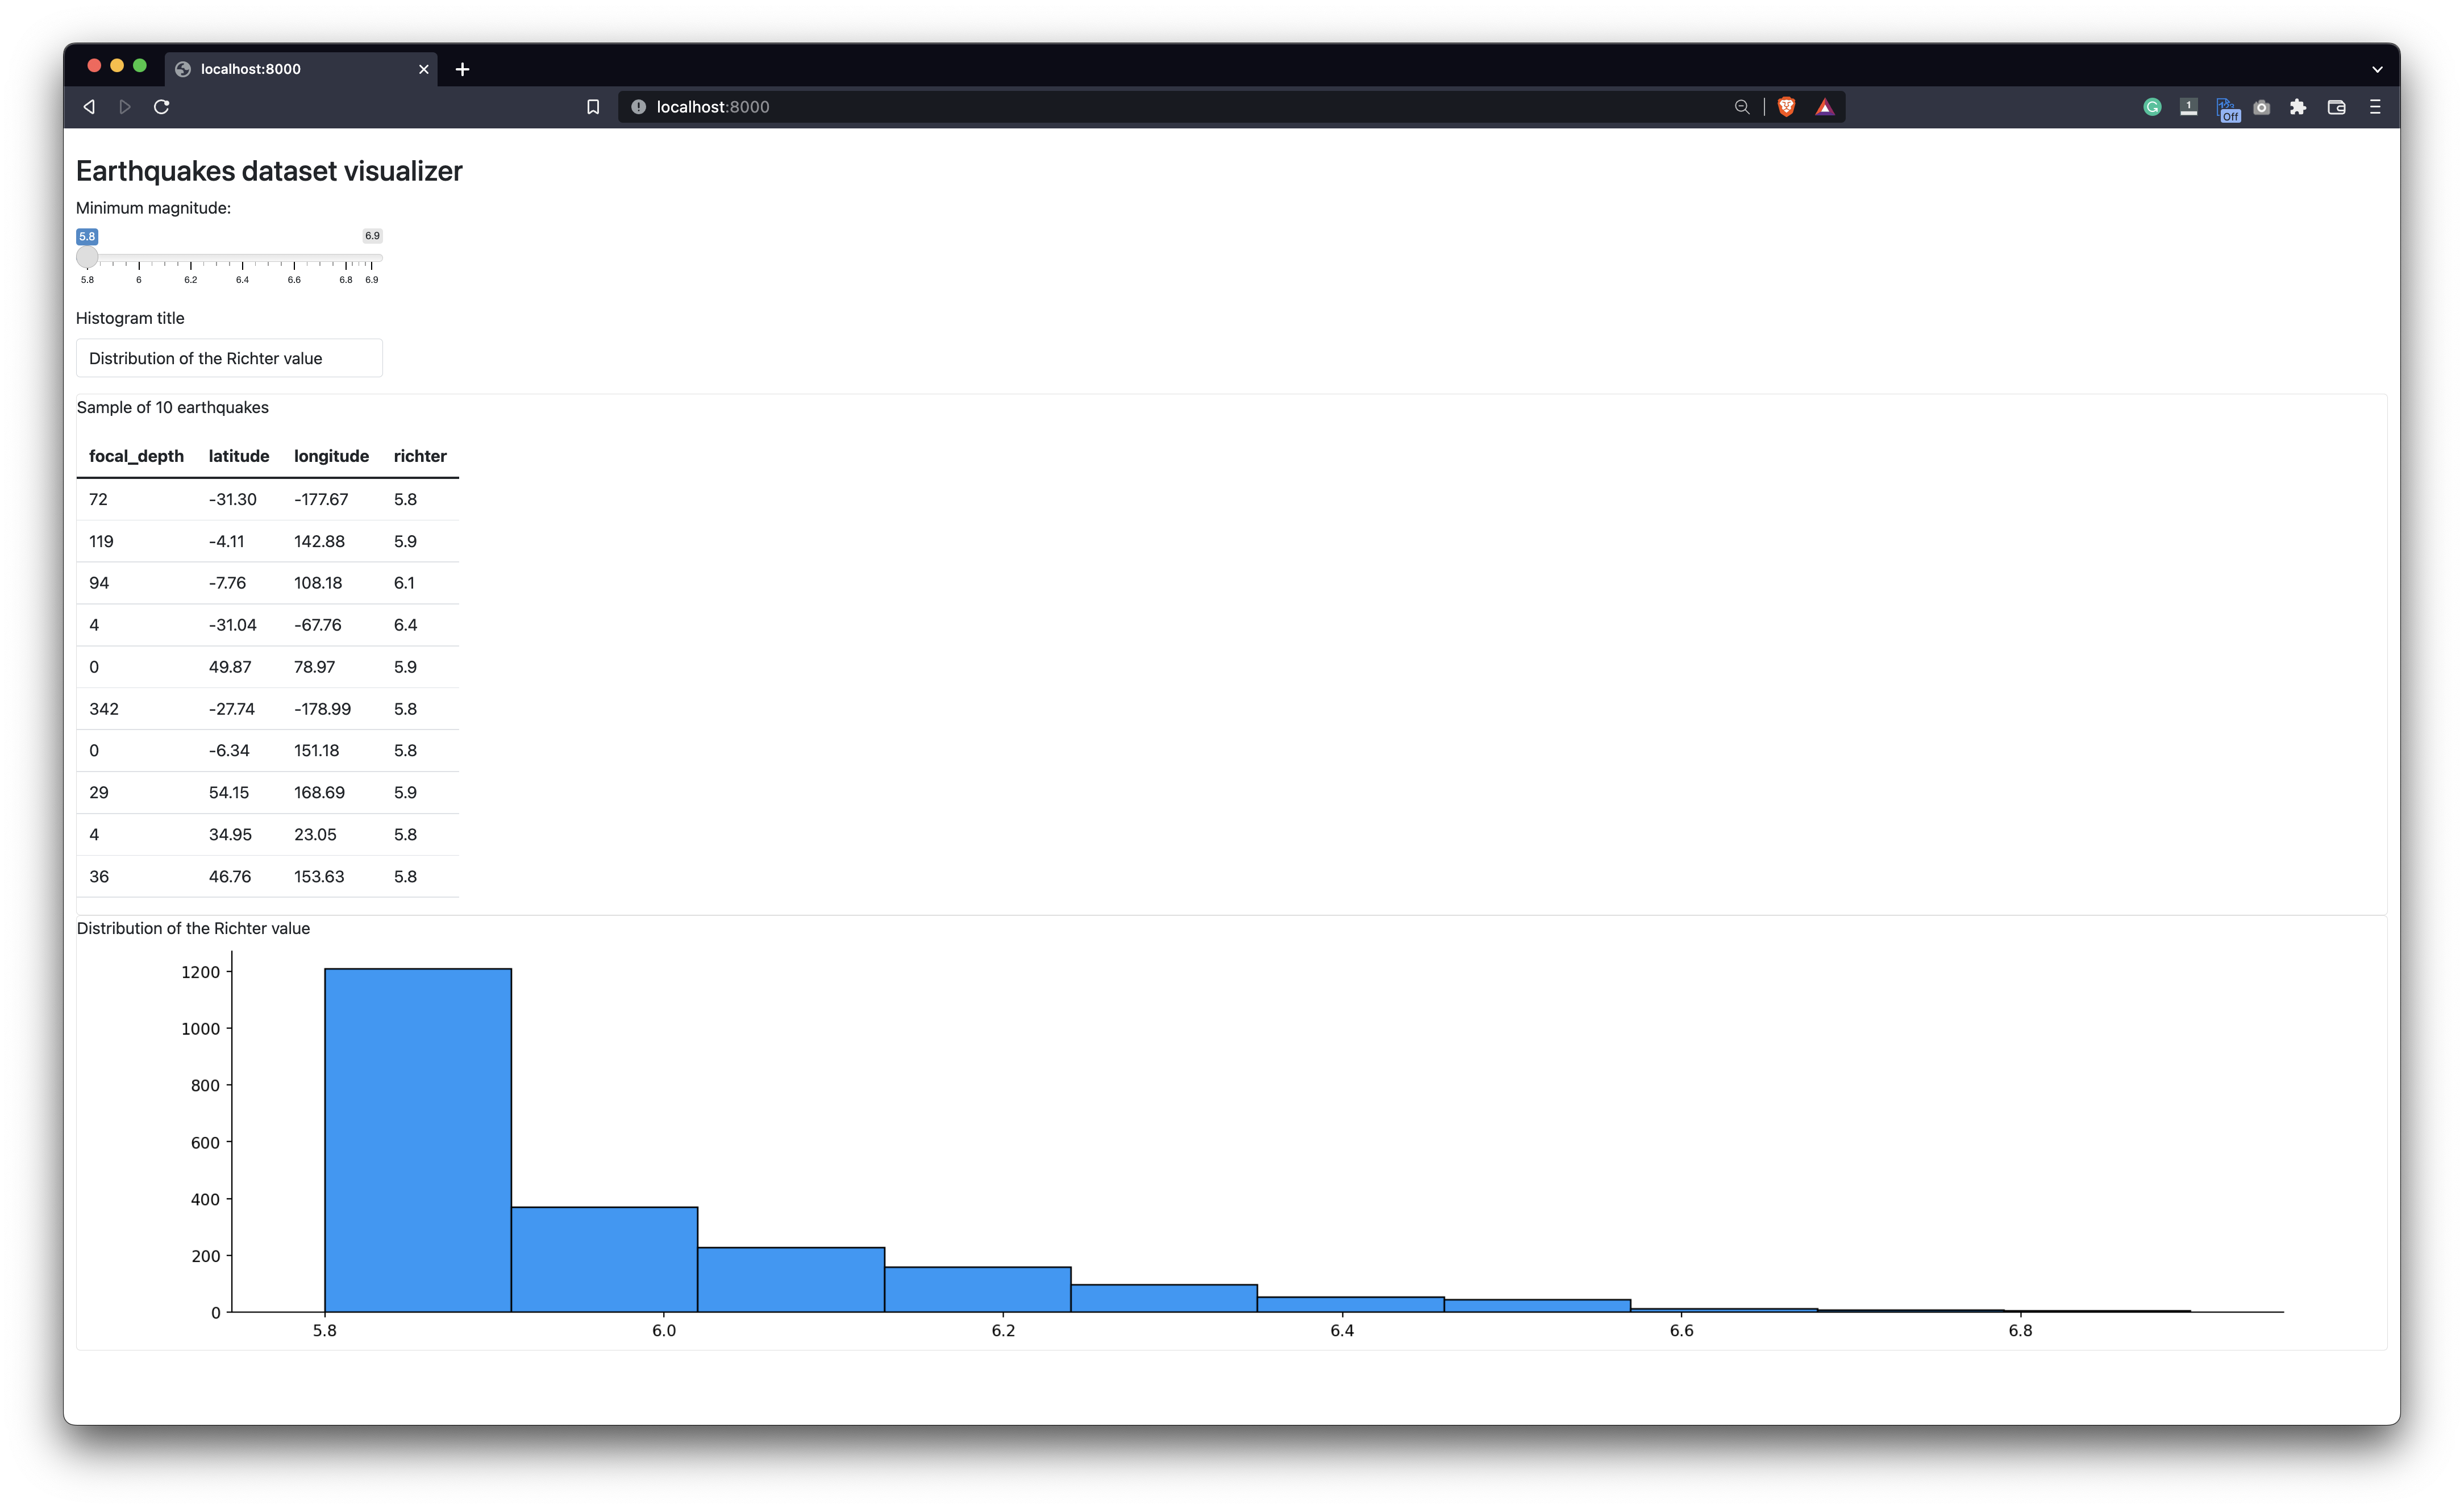
Image 1 – Quakes Shiny for Python dashboard
You can play around with the input controls – here’s an example:
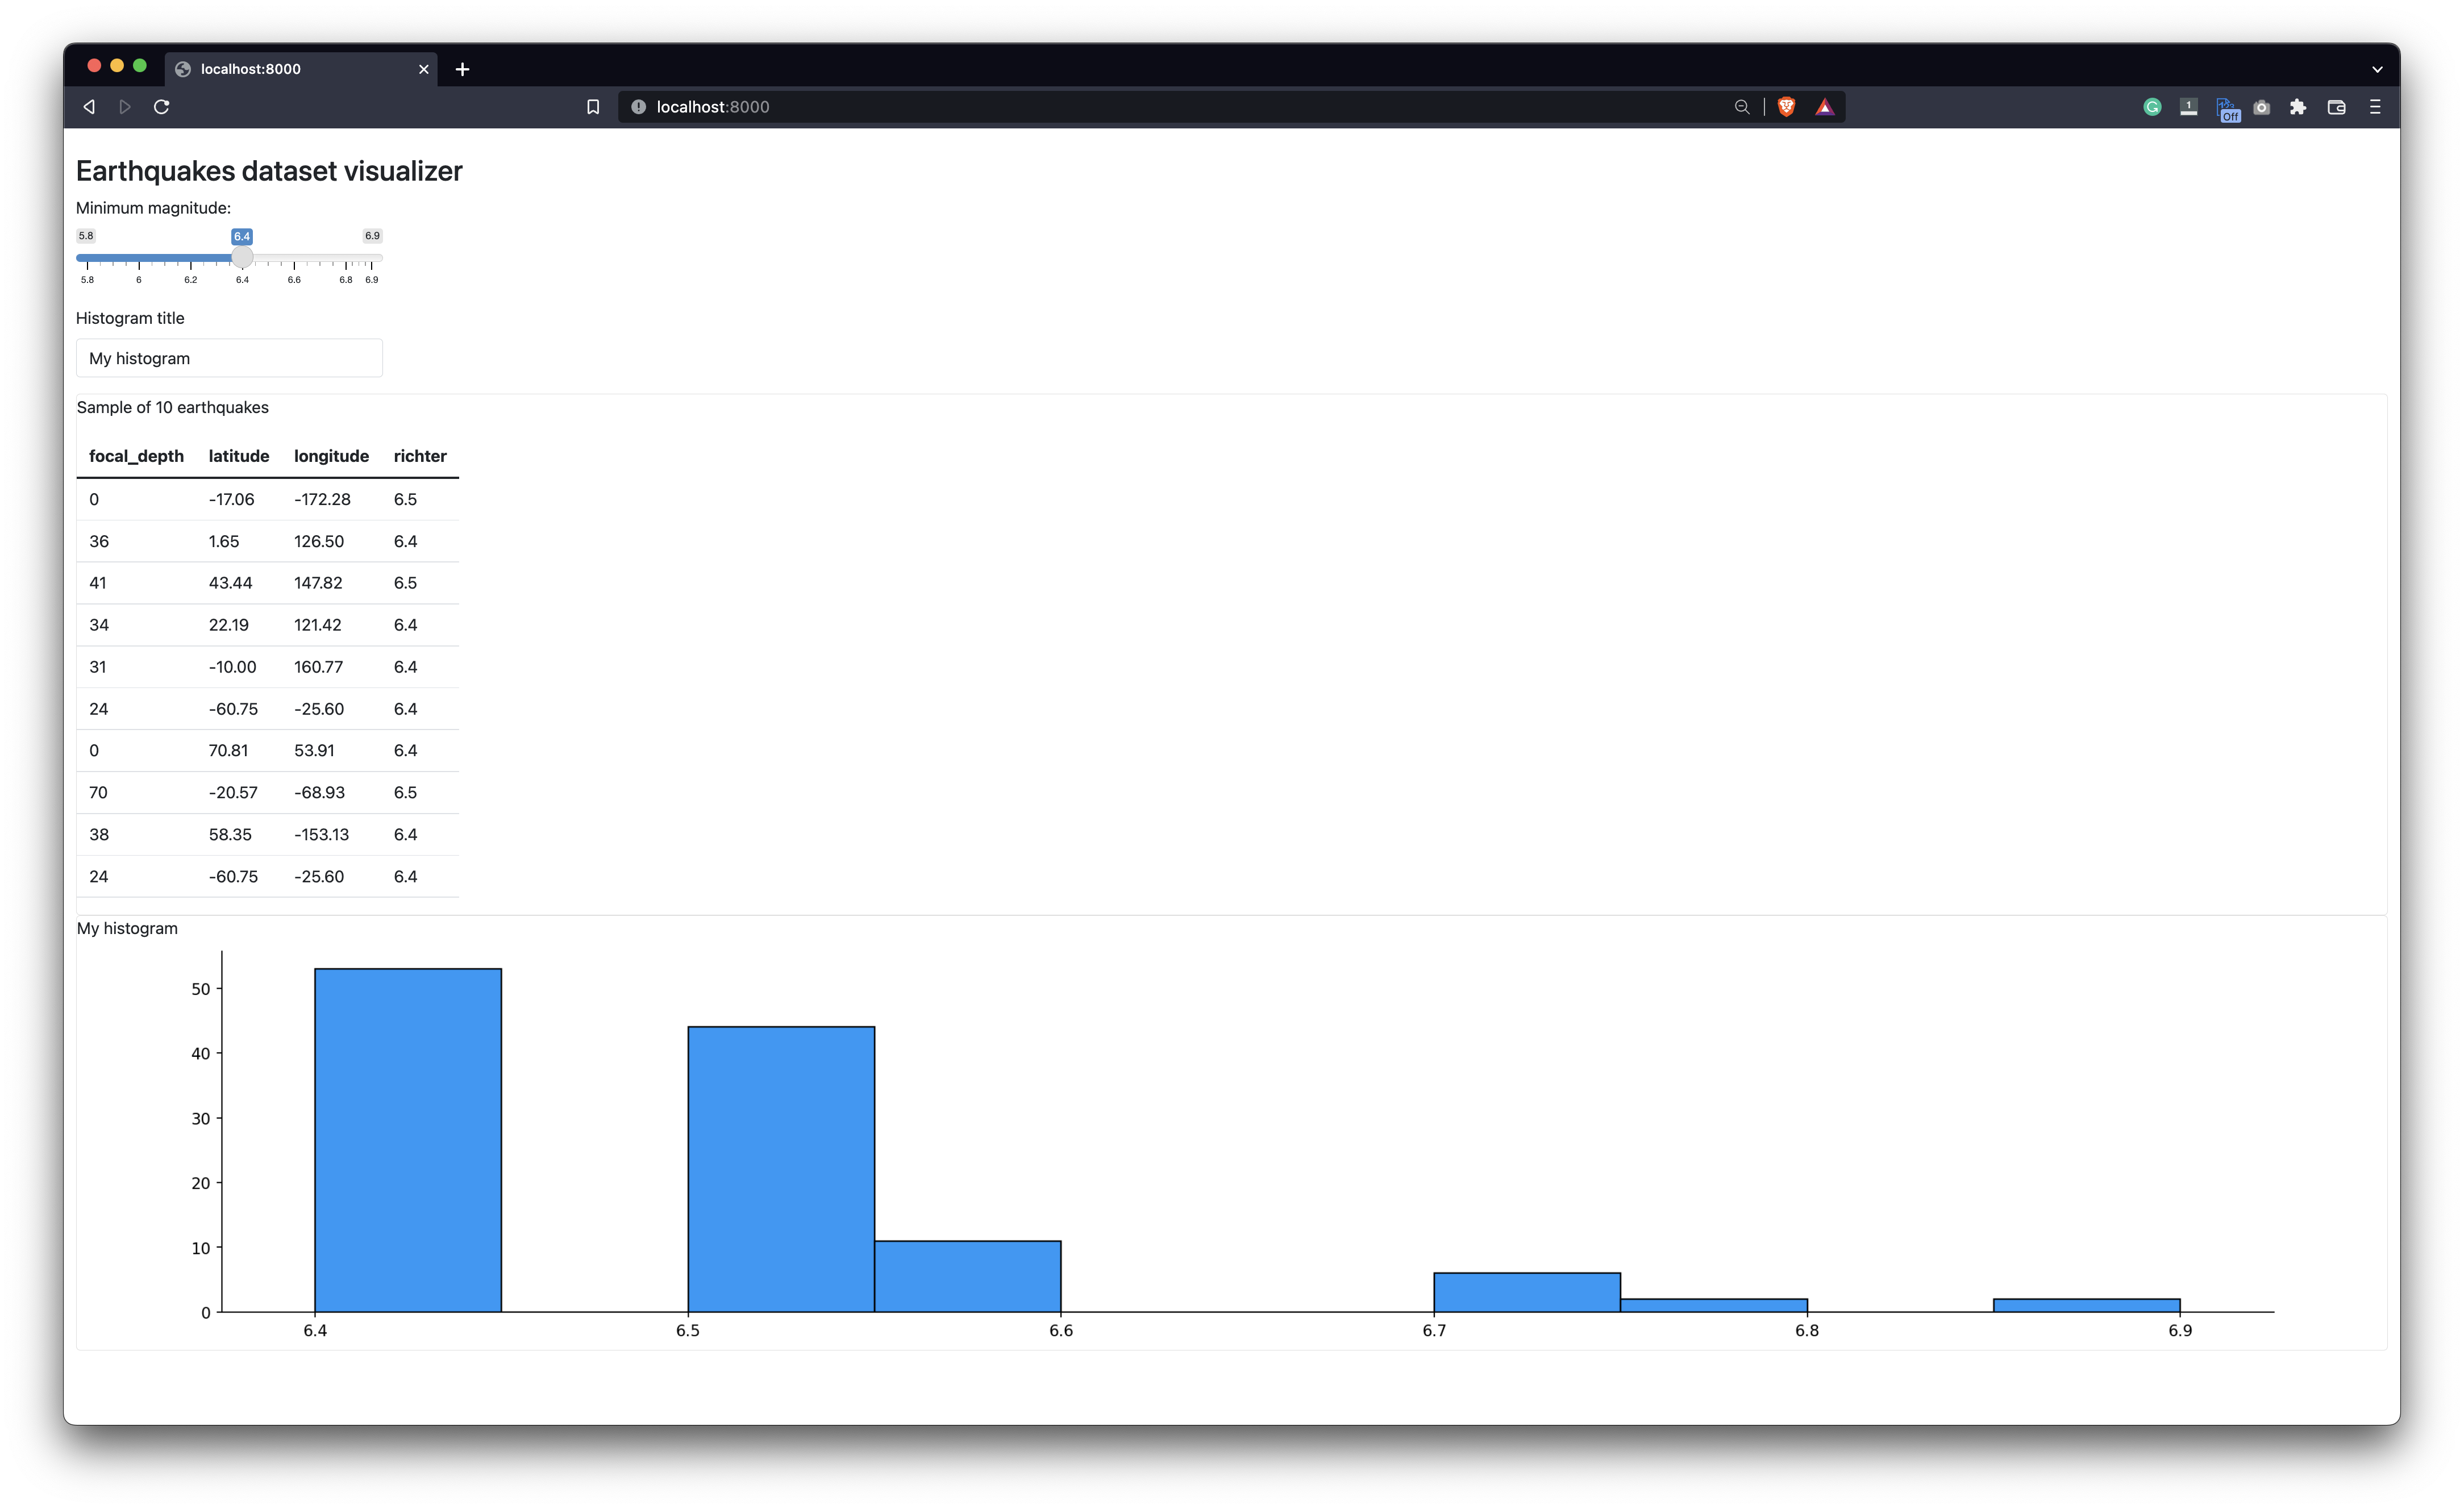
Image 2 – Quakes Shiny for Python dashboard (2)
And that’s almost all we need to start styling the dashboard. The only prerequisite left is creating and linking a static assets directory. Let’s cover that next.
The static files directory is used to host your images, scripts, styles, and everything else related to the app. A common practice is to create a www folder and put everything inside it. Create one yourself and make sure it’s in the same folder as app.py.
To connect Shiny for Python dashboard with the www folder, you’ll have to do the following:
Path class from the pathlib library.www_dir that will store an absolute path to the www directory.App(), specify an additional parameter static_assets and set it to www_dir.Here’s what your app.py file should look like after implementing the changes:
import pandas as pd
import matplotlib.pyplot as plt
from pathlib import Path
from IPython import display
from shiny import App, ui, render, reactive
display.set_matplotlib_formats("svg")
plt.rcParams["axes.spines.top"] = False
plt.rcParams["axes.spines.right"] = False


df = pd.read_csv("quake.csv")


app_ui = ui.page_fluid(
    ui.tags.head(
        ui.tags.link(rel="stylesheet", href="styles.css")
    ),
    ui.tags.h3("Earthquakes dataset visualizer", class_="app-heading"),
    ui.tags.div(class_="input_container", children=[
        ui.input_slider( ... ),
        ui.input_text( ... )
    ]),
    # Table
    ui.tags.div(class_="card", children=[ ... ]),
    # Histogram
    ui.tags.div(class_="card", children=[ ... ])

)


def server(input, output, session):
    ...


www_dir = Path(__file__).parent / "www"
app = App(ui=app_ui, server=server, static_assets=www_dir)
The dots ... are here just to make the snippet shorter – don’t actually replace the code with them.
Now we have everything we need to start writing some SCSS code.
At the same level where your app.py is, create a new directory styles and two files inside it: _variables.scss and styles.scss.
One of the neat things about SCSS is that you can separate the stylings into fragments (multiple files), and then include them in one main file. That’s just what we did with the variables.
This file will contain links to our fonts and declarations for different colors, sizes, and similar – everything you want to reuse in multiple places:
@import url('https://fonts.googleapis.com/css2?family=Poppins:wght@400;700&display=swap');

$font-stack: Poppins, sans-serif;
$bg-color: #F4F4F4;
$card-color: #FFFFFF;
$border-color: #EEEEEE;
$text-color: #333333;
$text-color-light: #505050;
$card-border: 1px solid $border-color;
$card-border-radius: 5px;
The styles.scss will import the variables fragment and declare styles for the entire app. Since the app is simple, the resulting file is quite short:
@use 'variables';
body {
font-family: variables.$font-stack;
background-color: variables.$bg-color;
color: variables.$text-color;
box-sizing: border-box;
margin: 0;
padding: 0;
}
.container-fluid {
max-width: 1280px;
margin: 0 auto;
}
.card {
background-color: variables.$card-color;
padding: 1rem 1.25rem;
margin: 1rem auto;
border: variables.$card-border;
border-radius: variables.$card-border-radius;
box-shadow: 5px 5px 15px 0px rgba(0,0,0,0.2);
transition: all 0.2s;
.card_title, #out_histogram_title {
color: variables.$text-color-light;
font-weight: bold;
text-transform: uppercase;
}
}
.card:hover {
box-shadow: 5px 5px 15px 0px rgba(0,0,0,0.4);
}
.app-heading {
text-transform: uppercase;
font-weight: bold;
margin-bottom: 1rem;
}
.input_container {
display: flex;
flex-direction: row;
background-color: variables.$card-color;
padding: 1rem 1.25rem;
margin: 1rem auto;
.shiny-input-container:first-child {
margin-right: 3rem;
}
}
table.shiny-table {
width: 100% !important;
text-align: center;
thead {
text-align: center !important;
tr {
text-align: center !important;
}
}
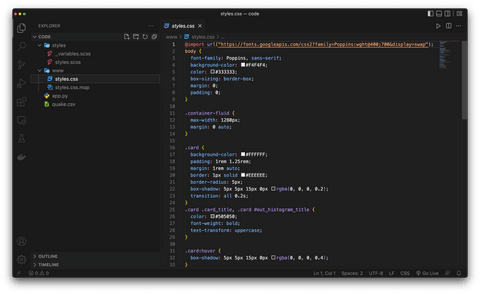
}That’s SCSS taken care of, but what do you actually do with it? The styles.css is linked in the dashboard, and we don’t have that file in the www directory.
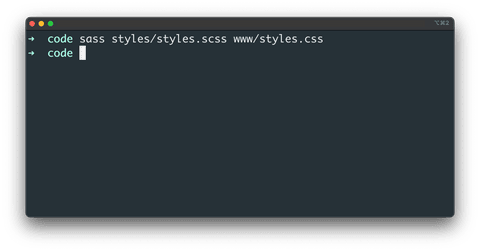
Well, assuming you have SASS installed, the compilation boils down to a single shell command:
sass <path-to-scss-file> <path-to-css-file>Here’s what it looks like in our case:
Image 3 – Compiling SCSS into CSS
And that’s it! The styles.css file is now present in the www folder:
Image 4 – Compiled CSS file
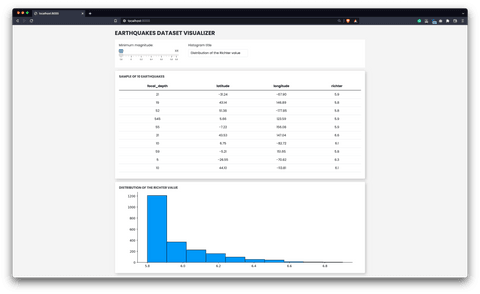
You can now refresh the app and see the styles in action:
Image 5 – Shiny for Python dashboard with SCSS styles
And that’s how you can work with SASS/SCSS in Shiny for Python. Let’s wrap things up next.
Want to see an earthquake dashboard design in R Shiny? Explore our Quakes Explorer built with shiny.fluent and imola.
There’s no one stopping you from using vanilla CSS in your Shiny for Python projects, but it’s always a good idea to keep up with the trends and best practices in the industry. SASS has been one for years, and it doesn’t seem like it’s going anywhere. It’s an excellent skill to learn and it will definitely make your job easier.
Curious about where Shiny application layouts are trending? We’ve got you covered.
What are your thoughts on Shiny for Python and SCSS integration? Do you use some alternative method for compiling SCSS? Please let us know in the comment section below. Also, feel free to continue the discussion on Twitter – @appsilon – We’d love to hear from you.
Need to make some reports quickly? Try Jupyter Notebook and Quarto integration.


