Share
Share Tweet
Tweet Share
Share


Can I Do that In R? Advanced Excel Functions in R for Data Manipulation

06 October 2023
Does Excel.. excel at everything? Should you consider R programming language instead? Well, yes – but not for the reasons you might initially think. Excel is fun and intuitive but has some obvious problems with reproducibility and scalability. More on that later.
This article will walk you through several examples of Excel functions in R. We’ll see how things are done in Excel and in R, and then do our best to compare the two. Maybe you’re a seasoned Excel user and want to dip your toes in data manipulation in R. You’ve found just the right place to start.
Looking to combine R and Excel? We bring you list of packages to combine the best of both worlds.
Table of contents:
- Creating and Reading Data in Excel vs. R
- Basic Excel Functions in R – Getting Your Feet Wet
- Excel Functions in R for Data Summarization and Charts
- Why Transition from Excel to R – Is R a Viable Excel Alternative?
- Summing up Excel Functions in R
Before We Start
In this article, we’ll delve into the world of data manipulation in R and explore how it compares to Excel, especially when dealing with advanced functions. We’ll walk you through various examples, showing how to perform tasks that you might be familiar with in Excel but with the power and flexibility of R. But before we dive into the exciting world of data manipulation and analysis, let’s address an essential aspect for beginners: package installation.
Package Installation
If you’re new to R, it’s important to note that R’s strength lies in its extensibility through packages. We’ll use several R packages, such as dplyr, readxl, lubridate, and ggplot2, to enhance data manipulation and visualization. For our beginner audience, it could be helpful to understand how to install these packages. To get started, you can install these packages using the install.packages() function, which ensures that you have the necessary tools at your disposal to follow along with the examples in this article.
This video is a brief walkthrough for installing R packages in RStudio and from GitHub.
So, let’s embark on this journey of data manipulation in R, armed with the right tools to excel in your data tasks!
Creating and Reading Data in Excel vs. R
First things first, we need some data. Creating it in Excel is easy, fast, and intuitive. After all, it was built for creating and manipulating somewhat decently large data sheets.
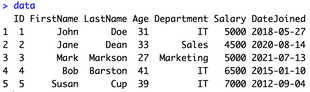
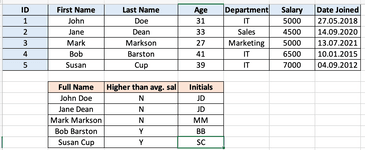
For this article, we’ll create a dataset of employee information. We’ll keep track of their first name, last name, age, department, salary, and the date they joined our made-up company. Feel free to create your own Excel data sheet for your needs. I recommend keeping it relatively simple for the tutorial.
Here’s what the data looks like:
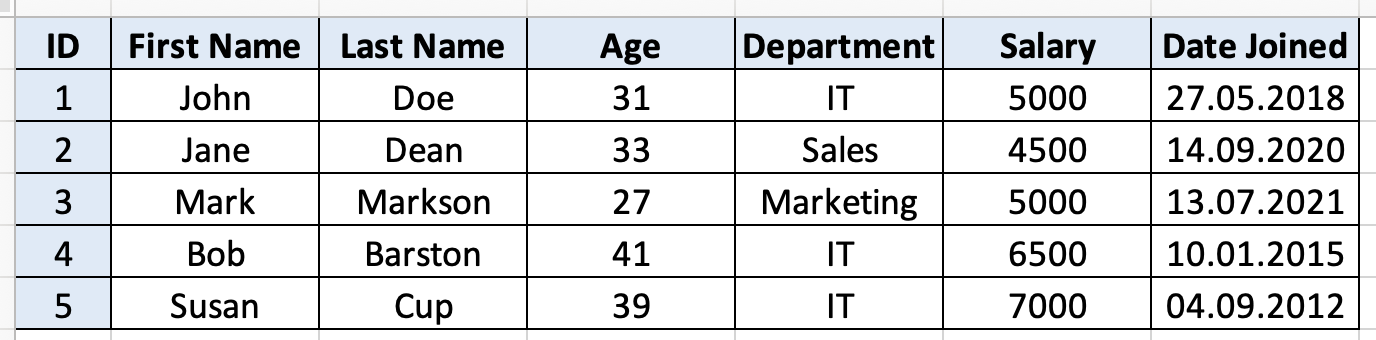
Image 1 – Tabular data created in Excel
The question now is – how can you replicate this in R? Well, you can declare a dataset from scratch by wrapping it into a data.frame() and providing a list of column names and values, as shown below:
data <- data.frame(
  "ID" = c(1, 2, 3, 4, 5),
  "FirstName" = c("John", "Jane", "Mark", "Bob", "Susan"),
  "LastName" = c("Doe", "Dean", "Markson", "Barston", "Cup"),
  "Age" = c(31, 33, 27, 41, 39),
  "Department" = c("IT", "Sales", "Marketing", "IT", "IT"),
  "Salary" = c(5000, 4500, 5000, 6500, 7000),
  "DateJoined" = c(as.Date("2018-05-27"), as.Date("2020-08-14"), as.Date("2021-07-13"), as.Date("2015-01-10"), as.Date("2012-09-04"))
)
data
Here’s what the dataset looks like:
Image 2 – Tabular data created in R
Or, you can leverage the already existing Excel file, and use packages such as readxl to load it:
library(readxl)

data <- read_xlsx("data.xlsx", sheet = "Sheet1")
data
This is the output you’ll see:
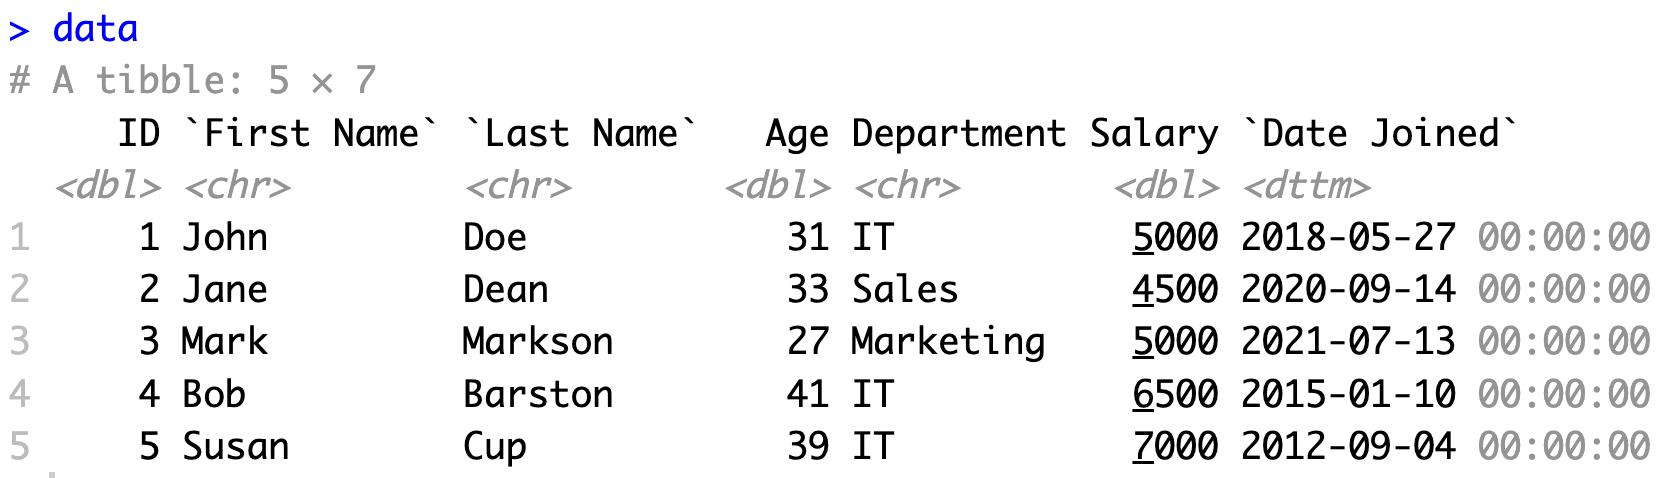
Image 3 – Reading an Excel File in R
The thing you need to remember about R is that it connects to virtually any data source, from local files to databases and anything in between. That’s not a luxury you get with Excel.
Sure, you can connect to the data source manually and export the data, but that’s not the same. We like things automated at Appsilon.
Basic Excel Functions in R – Getting Your Feet Wet
This section will walk you through some basic operations, such as summary statistics, string/date manipulation, and conditionals. We’ll implement the identical logic in R and Excel to see how they compare.
Let’s start with simple summary statistics.
Simple Summary Statistics
Think of these as points you always want to know the value for. What’s the average of something, or what is the range of values in a column? These functions will give you the answer.
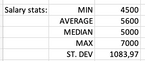
We’ll use the Salary column for the calculation. In Excel, it’s located in a column F and spans between rows 2:6. Yours may differ, so change the values in the formulas accordingly.
Here’s an example set of functions you can use to find the minimum, average (mean), median, and maximum, but also its standard deviation:
=MIN(F2:F6)
=AVERAGE(F2:F6)
=MEDIAN(F2:F6)
=MAX(F2:F6)
=STDEV(F2:F6)
Below are the results you’ll see in Excel:
Image 4 – Summary statistics in Excel
Neat, and something you’re used to, but how can you translate it into R?
R programming language has functions built-in for taking care of calculations like these. For example, you can call the mean() function and pass in the column of interest (dataframe_name$column_name) to get the value out.
The surrounding paste() function is here just to give some context, or to print the function name in front of the value:
paste("Min. salary:", min(data$Salary))
paste("Average. salary:", mean(data$Salary))
paste("Median salary:", median(data$Salary))
paste("Max salary:", max(data$Salary))
paste("STdev. salary:", sd(data$Salary))
These are the results you’ll see:
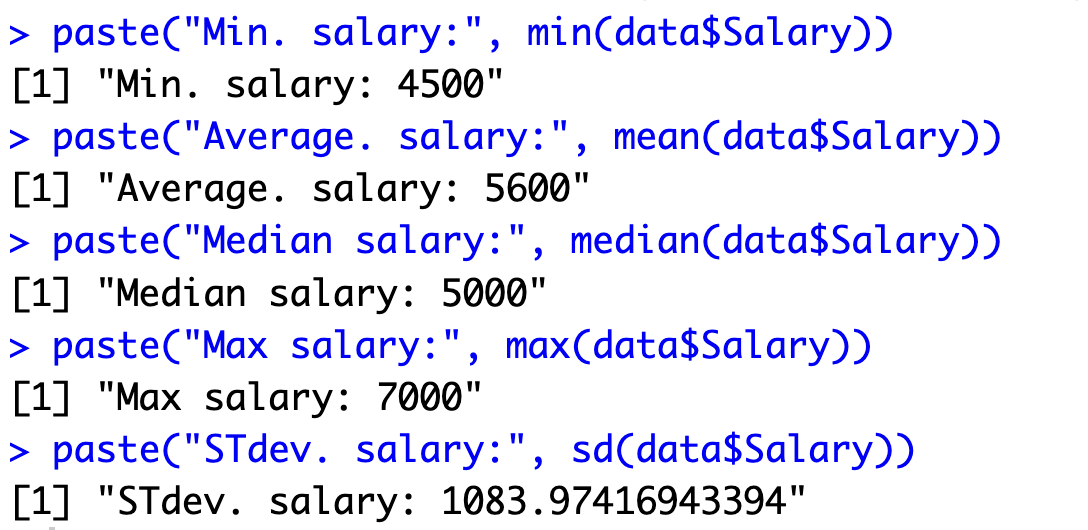
Image 5 – Summary statistics in R
And that’s the basics of summary statistics for you. Up next, let’s discuss string concatenation.
Concatenation
String concatenation is one of the typical data manipulation and preprocessing operations. The idea is to take two (or more) columns and combine their values into a single new column.
Luckily for us, we have the First Name and Last Name columns that beg to be combined into a Full Name column.
In Excel, you’ll want to call the CONCAT() function and pass in both values with a single space in between. Here’s an example:
=CONCAT(B2;" ";C2)And here’s what everything will look like when you apply the formula to the entire column:
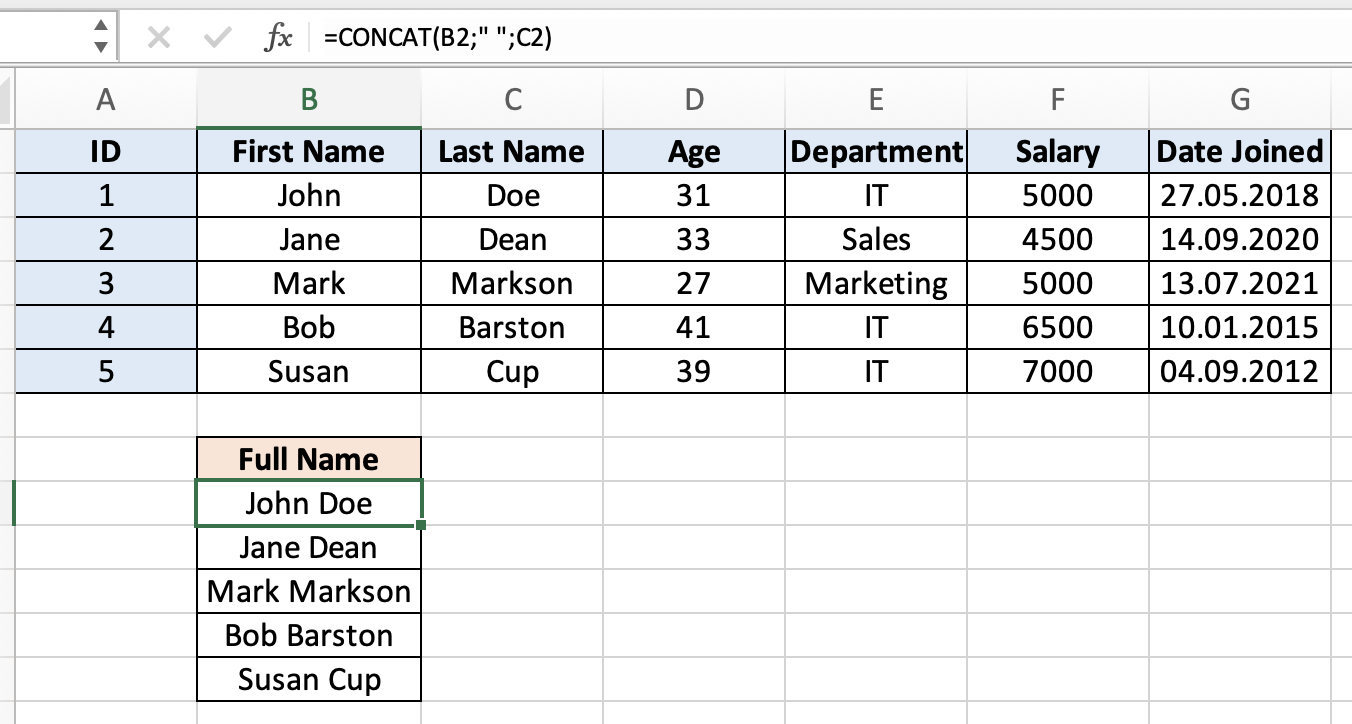
Image 6 – String concatenation in Excel
In R, you can use the mutate() function from dplyr to do the same:
library(dplyr)

data %>%
  mutate(FullName = paste(FirstName, LastName, sep = " "))
The results are identical, not taking into consideration the UI differences:
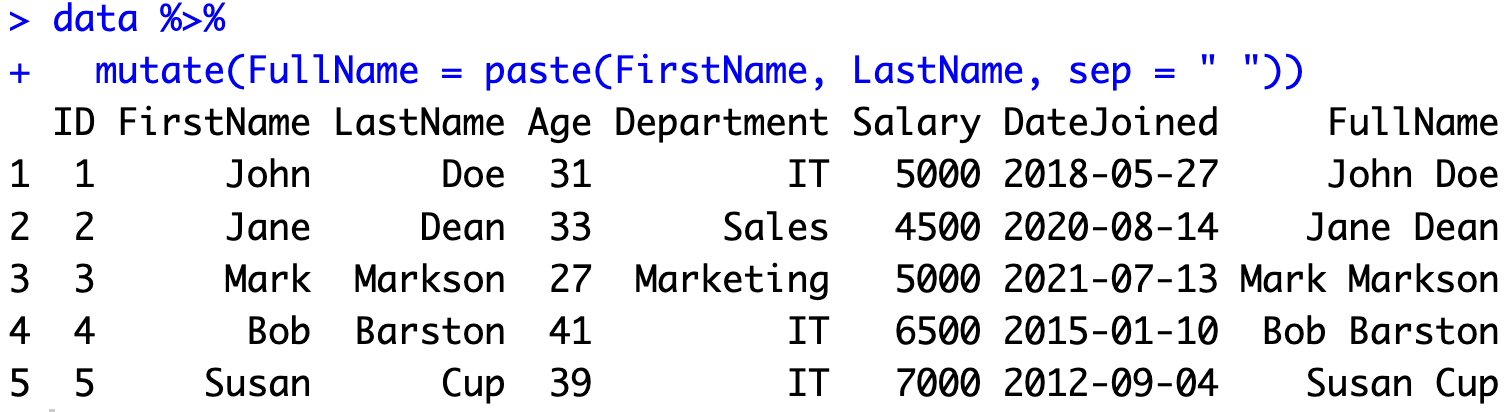
Image 7 – String concatenation in R
The mutate() function is responsible for creating new attributes. In it, you’re basically assigning values to a new column. The paste() function will combine multiple fields to produce the final results.
Are you new to R dplyr and want to learn more? We have a complete beginners guide to dplyr on our blog.
Conditions
Up next, let’s tackle conditions. In here, you want the cell value to populate differently, depending on values from different columns.
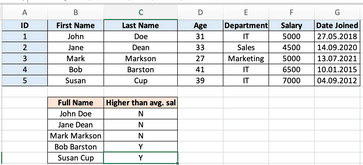
We’ll create a new column named Higher than avg. sal that will have a value of “Y” if the salary for a given employee is greater than the average salary across the company, and “N” otherwise.
Here’s the Excel formula you need to use:
=IF(F2>AVERAGE(F$2:F$6); "Y"; "N")And these are the results:
Image 8 – Conditional statements in Excel
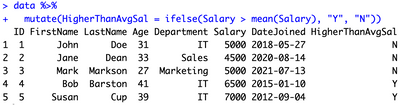
In R, you can once again use the mutate() function and assign the result to be the output from the ifelse() function. The declaration is pretty much self-explanatory:
data %>%
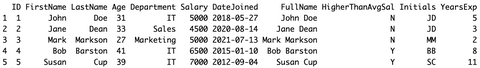
mutate(HigherThanAvgSal = ifelse(Salary > mean(Salary), "Y", "N"))The results are once again identical:
Image 9 – Conditional statements in R
And that’s conditionals for you. Up next, let’s go over string manipulation.
String Manipulation
You can do all sorts of stuff with strings in Excel and R. We’ll demonstrate that on a rather simple example of extracting initials from first and last names.
To achieve this in Excel, you’ll need to use the familiar CONCAT() function, with its inner elements being the results of a LEFT() function. This one will extract the first N letters from a string.
If we extract only the first letter for both first and last names and then combine them, we will get the initials.
Here’s the implementation in Excel:
=CONCAT(LEFT(B2;1); LEFT(C2;1))These are the results you should see:
Image 10 – String manipulation in Excel
Things are quite similar in R. Instead of LEFT, you’ll need to use substr() and paste the start and end points. These are then surrounded by the familiar paste() function:
data %>%
  mutate(Initials = paste(substr(FirstName, 1, 1), substr(LastName, 1, 1), sep = ""))
And you get the same output as with Excel:
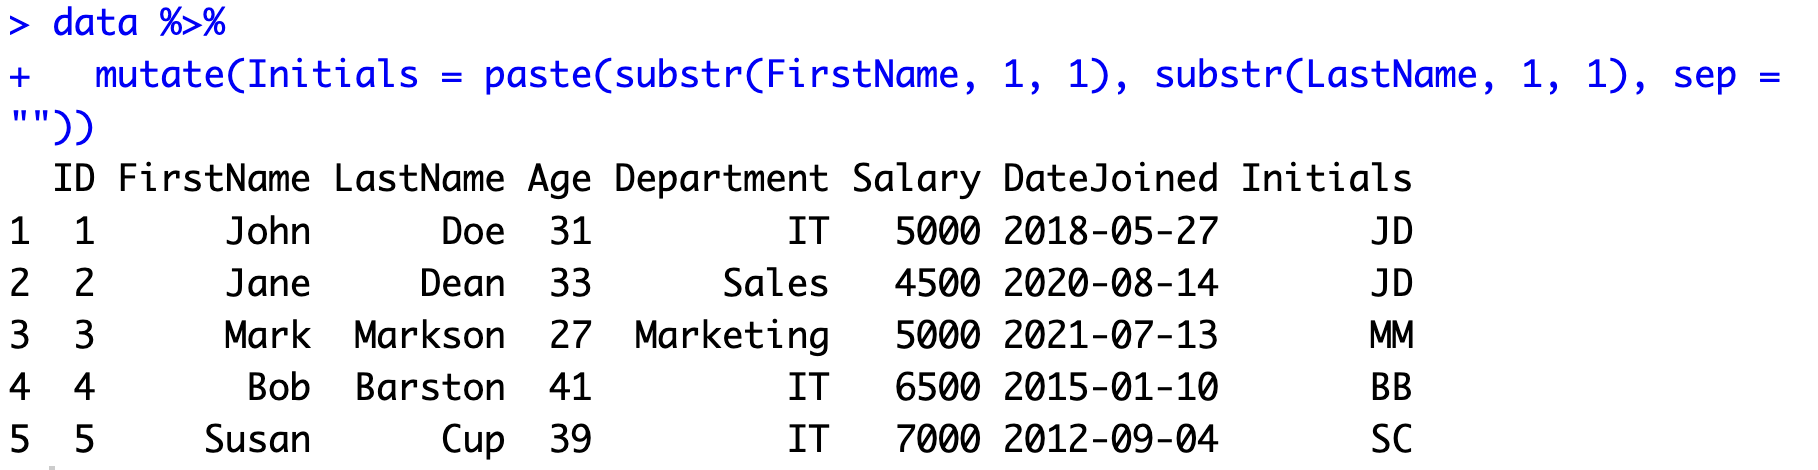
Image 11 – String manipulation in R
And finally, let’s go over date manipulations.
Date Calculations
There’s no getting around dates. They’re an integral part of any dataset, and in ours, they signify the exact day at which the employee has joined the company.
What we’re aiming to accomplish is simple – calculate how many years has the employee been in our company.
In Excel, one way of doing this is by subtracting the year of the hire date from the year of the current date. Here’s an example:
=YEAR(TODAY())-YEAR(G2)This is what you should see populated in your column:
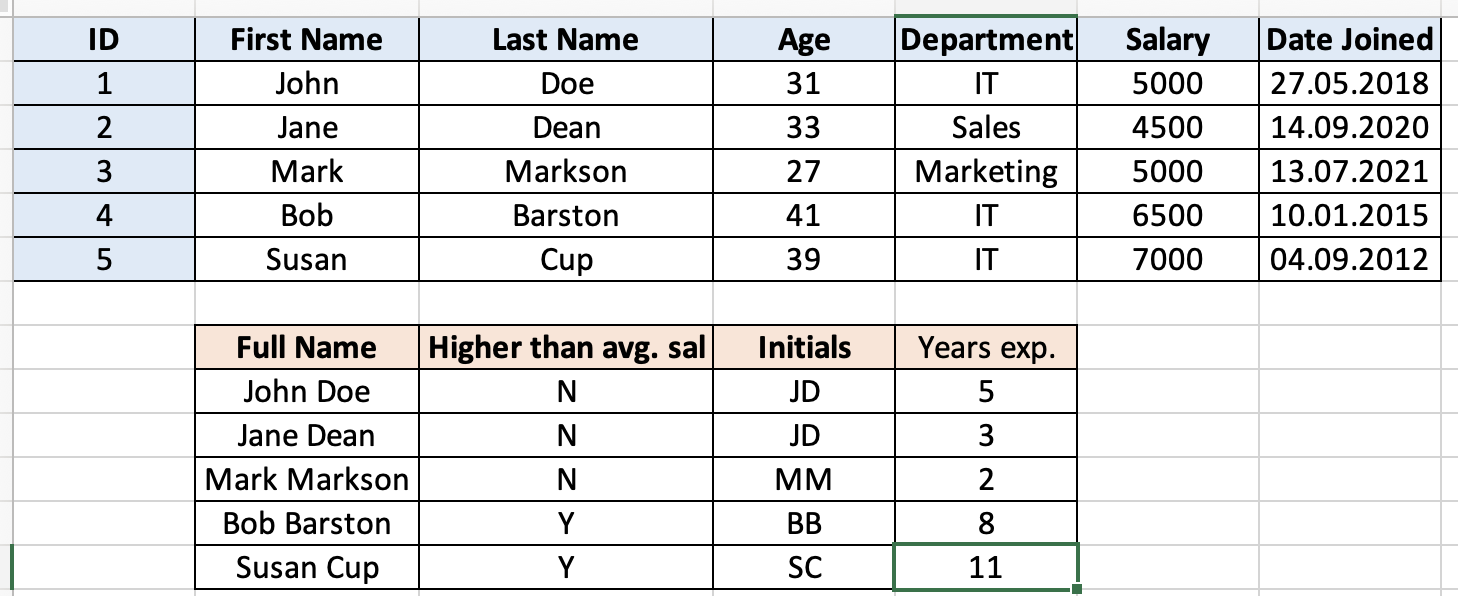
Image 12 – Date calculations in Excel
Doing the same in R is much easier with the lubridate pacakge. Make sure to install it first – install.packages("lubridate"), and then use the function call similar to the one from Excel:
library(lubridate)

data %>%
  mutate(YearsExp = year(today()) - year(DateJoined))
Once again, the results are identical:
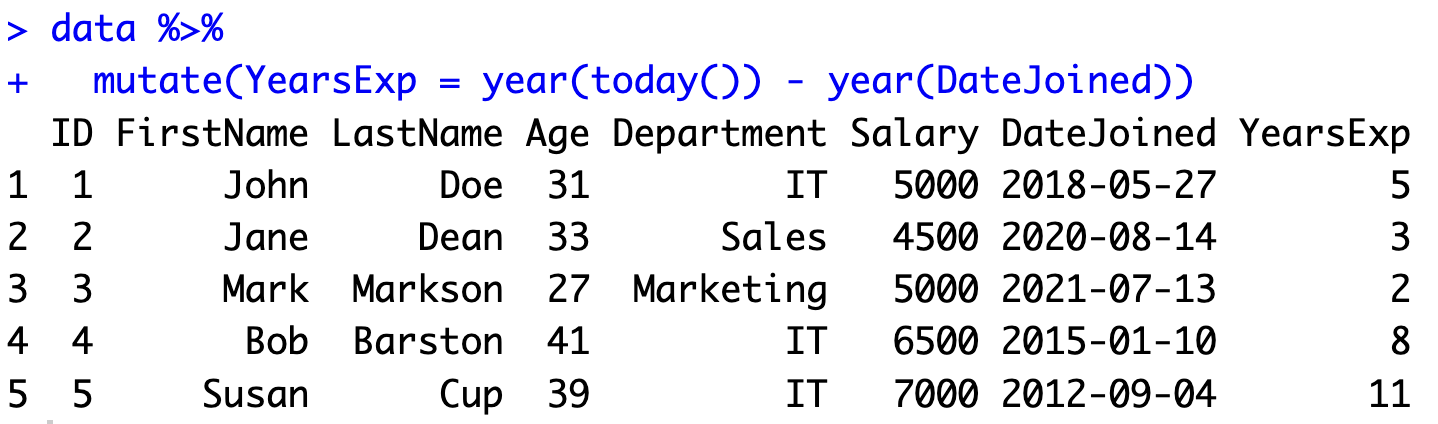
Image 13 – Date calculations in R
But we’re not done with this section yet. R has a secret weapon that will leave a lot of Excel users jealous.
R dplyr – Do Everything With One Command
And the secret is – the dplyr package allows you to chain operations together. For example, you can create all of the previously seen attributes in a single call.
Here’s the code for doing so:
library(dplyr)
library(lubridate)

data <- data %>%
  mutate(
    FullName = paste(FirstName, LastName, sep = " "),
    HigherThanAvgSal = ifelse(Salary > mean(Salary), "Y", "N"),
    Initials = paste(substr(FirstName, 1, 1), substr(LastName, 1, 1), sep = ""),
    YearsExp = year(today()) - year(DateJoined)
  )

data
This is the output you will see:
Image 14 – Multiple column creation with R dplyr mutate()
With R, there’s no guesswork in what’s going on. You can clearly read the code and the order of operations.
Excel Functions in R for Data Summarization and Charts
This section will consider one other important aspect of the R vs. Excel debate – charts. Excel makes it easy to produce good-looking data visualizations, but you’ll have to wait and see if it’s up to par with what R has to offer.
Conditional Aggregation and Charting in Excel
Our chart logic is quite simple. We want to display the total monthly salaries across departments. This calculation doesn’t involve any work for the Sales and Marketing departments, since there’s only one employee there. But still, the formula will scale to future employees.
The SUMIF() function in Excel allows us to calculate the sum only on those records where a defined condition is met. You first define the condition range (departments), then the criterion (IT, Sales, Marketing), and finally the range from which the values will be summed up:
=SUMIF(E2:E6;"IT";F2:F6)
=SUMIF(E2:E6;"Sales";F2:F6)
=SUMIF(E2:E6;"Marketing";F2:F6)
Once calculated, you can select the attributes and create your chart with a couple of clicks:
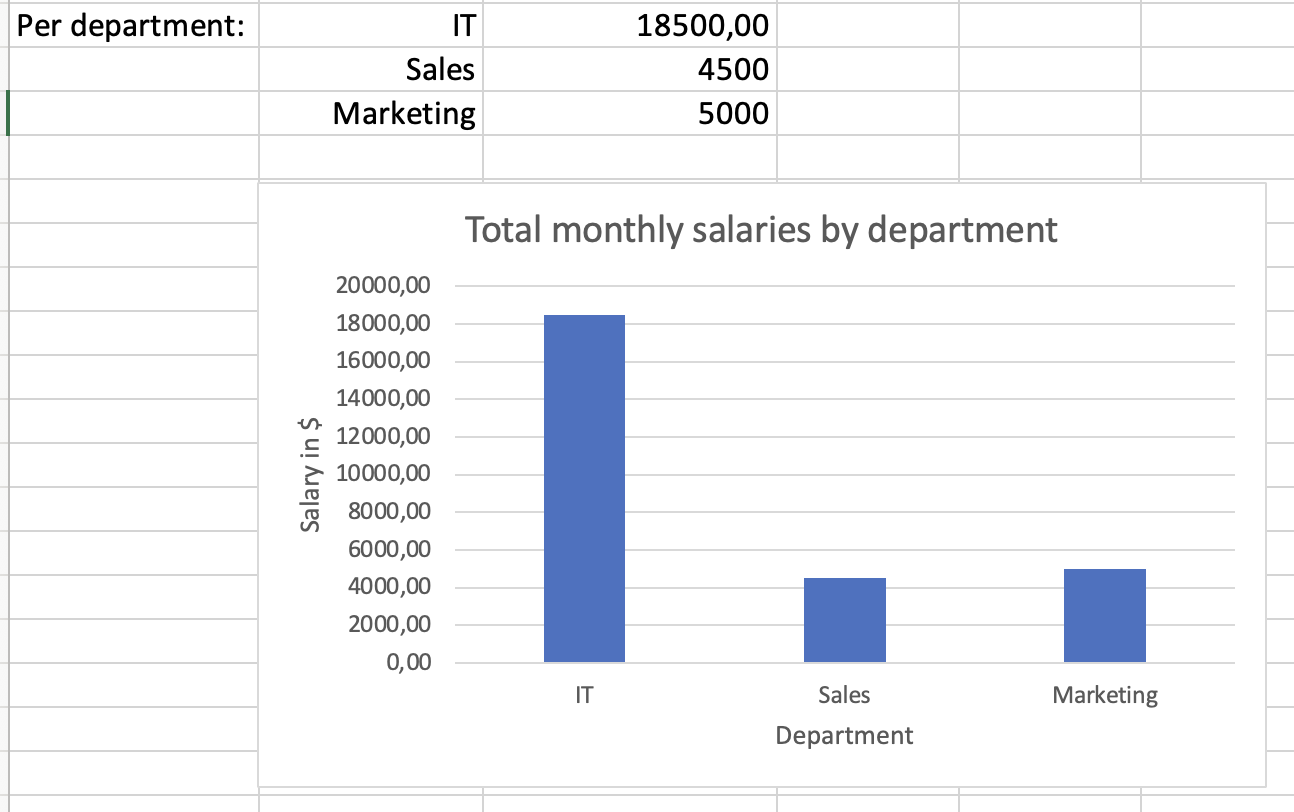
Image 15 – Chart in Excel
Neat. Let’s see what we have to do to achieve the same in R.
Conditional Aggregation and Charting in R
R’s dplyr packs a convenient group_by() function that allows us to group the dataset by an apartment, and calculate the summary statistics from there.
All of the results will be stored to a new data.frame, just for the sake of easier visualization:
department_salaries <- data %>%
  group_by(Department) %>%
  summarize(Salary = sum(Salary))

department_salaries
This is what the summarized data.frame looks like:
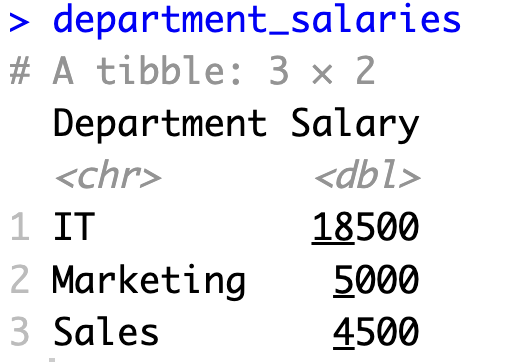
Image 16 – Summary statistics in R
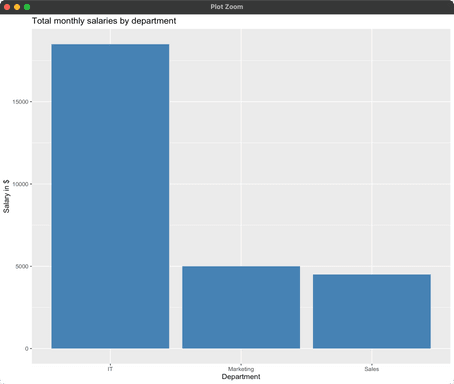
You can now leverage the ggplot2 package to make a bar chart. There’s no point in explaining the function call line by line, so just read it and see what happens if you remove some bits and pieces:
library(ggplot2)

bar_chart <- ggplot(department_salaries, aes(x = Department, y = Salary)) +
  geom_bar(stat = "identity", fill = "steelblue") +
  labs(title = "Total monthly salaries by department",
       y = "Salary in $",
       x = "Department")

bar_chart
This is the chart you’ll see after running the code:
Image 17 – Chart in R with ggplot2
Looking to dive deeper into ggplot2? We have an entire article series on making stunning charts, bar charts included.
And that’s basically it for the “how” part. The only thing left to do is discuss the reasons why you might consider switching from Excel to R.
Why Transition from Excel to R – Is R a Viable Excel Alternative?
Excel isn’t going anywhere, that’s a fact. It’s a tool enjoyed by millions worldwide, while R is a more niched technology. And that’s fine, R was never meant to replace Excel for average users.
Where R becomes interesting is if you consider yourself an Excel power user. That’s where you run into Excel limitations, such as:
- Limited data capacity: This will depend on your Excel version, but the more recent ones have a cap of 1048576 rows and 16384 columns. It might be insufficient for handling huge datasets.
- Performance issues: Excel can become slow and unresponsive when dealing with complex calculations and large datasets, whereas R is designed to handle such tasks efficiently and without hiccups.
- Limited statistical analysis: Excel provides basic statistical functions, while R offers a comprehensive suite of statistical packages, allowing you to do more advanced things.
- Lack of version control: Excel lacks built-in version control, making it difficult to track changes and collaborate on projects compared to R, which can use version control systems like Git. Sure, you can version control an Excel file with Git in theory, but no one does it for a reason.
- Reproducibility and automation challenges: Excel lacks built-in features for reproducibility, making it harder to document and reproduce data analysis compared to R, which supports scripts and notebooks. Also, Excel requires manual execution of tasks, making it less suitable for automated data processing and analysis compared to R.
This is just a handful of reasons why we think Excel is a no-go for power users and companies working with big datasets. Your mileage may vary, and you’re likely to find additional advantages/disadvantages in your area of work.
But still, we think R is a viable Excel alternative whenever you do anything south of basic analysis and visualization.
Summing up Excel Functions in R
And there you have it – Excel functions in R, and why R is a viable alternative to Excel, especially as the amount of data grows. We hope the transition to R doesn’t scare you. It’s a quite simple programming language, but will definitely require some time to get used to. It’s a new way of thinking and implementing actions, after all.
The examples provided today should be enough to get you started. R’s dplyr package supports pretty much anything Excel does, at least in the realm of data analysis and manipulation. If you want to visualize your data, look no further than ggplot2 for static visualizations.
Did you successfully transition from Excel to R? Or did you find a reason not to? Whatever the case, make sure to share your thoughts with us in the comment section below. You can also reach out on Twitter – @appsilon.
Is Excel obsolete? Here’s how (and why) to switch to R Shiny instead.
Contact Us
Project Manager

Get Updates
Subscribe to Shiny Weekly Newsletter
Join 4000+ Shiny enthusiasts to see the latest Shiny news from the R community.