


 Share
Share Tweet
Tweet Share
Share


Unraveling the Segment Anything Model (SAM)

20 October 2023
Join the Shiny Community every month at Shiny Gatherings
To improve the detection of genetic signatures in seeds correlated with their dormancy, we have trained computer vision models. These models have captured more than was previously understood about the mechanisms of dormancy. Genetic research with computer vision is opening up the field to new discoveries and potential for growth.
New to computer vision? Read our guide on getting started with fastai, ResNet, MobileNet, and more.
Navigate to a section:
Seed dormancy is an actively studied biological phenomenon crucial in many areas of the economy (e.g., at early stages of the food supply chain) and ecology (e.g., providing insights for studying the effects of the climate crisis on plants).
An active contributor to understanding the genetic mechanisms controlling seed dormancy is the Świeżewski lab, hosted at the Institute of Biochemistry and Biophysics of the Polish Academy of Sciences.
The entire cycle of seed generation, dormancy, and germination is investigated by the researchers at the lab, allowing to broaden the understanding of critical triggers in the process and providing the possibility of finding scalable ways of monitoring it.
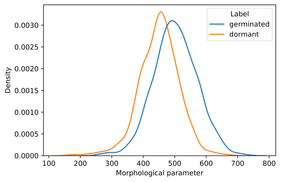
Looking at seeds of thale cress (Arabidopsis thaliana), the researchers had noticed that a morphological parameter differentiates to some extent the seeds germinated and are still dormant after a key period of two weeks from the moment of observation.
Image 1 – Distributions of one of the morphological parameters of germinated and dormant seeds are shown, indicating that the parameter is more likely to be large for germinated seeds.
The morphological parameter of seeds was estimated based on pairs of images obtained from a machine handling their planting. The researchers contacted us for assistance in analyzing the data with computer vision. They hypothesized that more visually distinguishable features might be found by such models, allowing them to discern between seeds that in two weeks from the moment the photos were taken will be dormant or germinated.
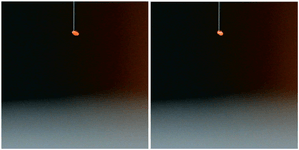
The data given to us consisted of several thousand pairs of images of seeds – each seed being roughly 0.2mm in diameter. The photos came from a machine used to automate their placement on trays where they are monitored.
Image 2 – Pair of photos of a single seed (suspended on a pneumatic needle)
The images were taken in a highly controlled environment, so it was clear that only a tiny fraction of the image contains the seed. Hence, we should identify the part of the image containing the seed to help the planned models focus on the seed’s features.
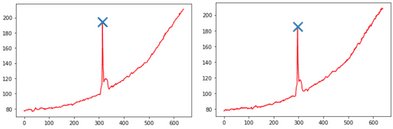
Additionally, cropping the photos to the seed reduces their size, speeding up the models’ training. However, the needle was not always placed in the same location of the image, so we needed to perform adaptive cropping. We decided to analyze the total color intensities for each row and column of pixels in the image – analyzing the obtained signals and automatically identifying the peaks in the red channels.
Image 3 – Signals with pixels’ intensities summed per row for the above photos (analogous plots were analyzed for the columns). The peaks are marked with a cross. The brightening of the background at the bottom of the images translates to a steadily growing intensity in color in the above plots.
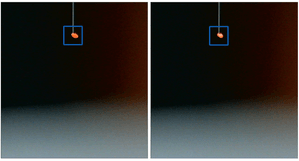
With a fixed square window centered on the locations of the peaks, we were able to crop the images to single out the seeds.
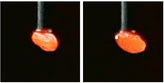
Image 4 – Photos of a seed with the seeds’ location identified using the cropping based on the location of the peak of color intensity
Image 5 – Cropped photos of a seed with actual resolution. Such images were later fed into the neural networks
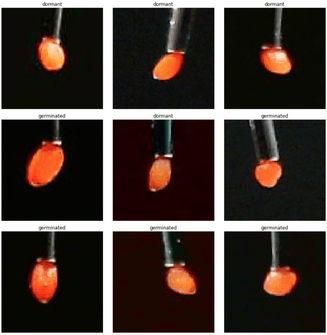
Image 6 – More examples of cropped images (a single image per pair is shown). It can be seen that it is next to impossible for a human eye to tell the difference between the classes
The resolution is not very high. Even though the original images consist of almost 400000 pixels each, the seeds typically take around 500 of them. This poses a challenge for any attempt to recognize the visual features of the seeds.
In addition to cropping the images, the data had to be cleaned concerning the labels we received. The seeds were labeled with one of four categories: germinated, dormant, lost, and dead. The first two were the most exciting classes for our purposes. We dropped the additional classes for the current analysis, as they were products of improper application of seed handling.
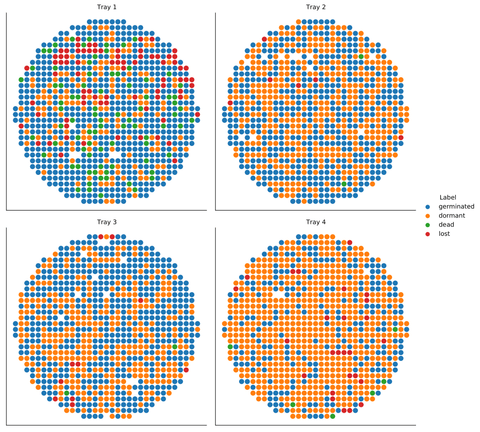
Interestingly, the data came from four different trays (each containing seeds from a distinct plant specimen), and each of them had a different distribution of the four initial classes. Many interesting observations can be made by visualizing the location of the seeds on the round trays.
Image 7 – The class distributions varied significantly between the trays
We selected 10% of the data (stratified by the label) as a validation set.
All results were evaluated on that set, and all the models trained only on the remainder training set.
We knew the morphological parameter of seeds correlates with their dormancy in the above sense, so we first trained a simple extreme gradient boosted tree model to predict the label (whether the seed germinated or stayed dormant). The predictions are based only on the value of that morphological parameter of the seeds identified individually in the two photos of a given seed.
The model reached 62% validation accuracy, which is not very impressive for a binary classifier but serves as a benchmark for further modeling. In particular, this benchmark quantifies the extent to which the seed dormancy can be explained with the mentioned morphological parameter alone.
To accommodate the data being pairs of RGB photos, we decided to adapt known neural network architectures to accept six input channels, mixing the information from the two photos only in the later dense layers.
We’ve started from training residual networks within the ResNet family as they are the most robust in our experience, offering promising results at a reasonable training pace. We settled on an adapted version of an EfficientNet version B3 which gave us a validation accuracy of 70%.
Using computer vision analyses of the pairs of images, we were able to predict seed dormancy with accuracy significantly higher than a model based solely on the single morphological parameter known to correlate with the dormancy of the seeds.
It’s an exciting finding as it supports the hypothesis that the genetic mechanisms controlling dormancy are also reflected in more visually distinguishable features.
To confirm the above result, we have analyzed how the model’s accuracy differs between different sizes of the seeds. While there is a difference (seeds with the morphological feature more pronounced being classified more accurately), it is not significant.
Moreover, the trays in which the seeds were grown were a stronger indicator of their dormancy predictability. Seeds from tray 2 were the hardest to predict, and those from tray 1 and 4 were the easiest (with accuracy reaching 75%).
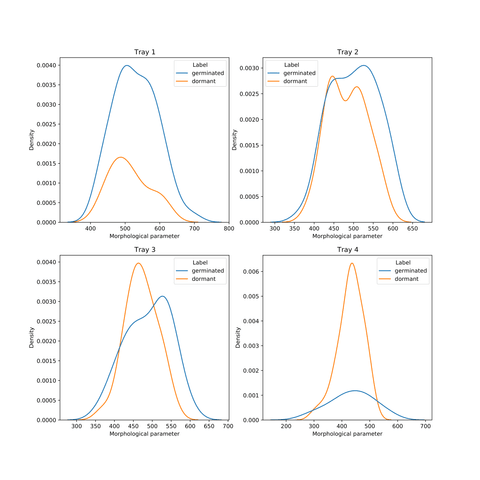
Interestingly, for trays 1 and 4, the morphological parameter distributions for both classes are not misaligned, and the balance between classes is complementary.
Image 8 – Distributions of the morphological parameter for the labels separately and individual trays. Trays 2 and 3 exhibit the shift of germinated seeds towards larger values, while trays 1 and 4 only to a modest extent – the two distributions for those trays are better aligned.
In this project, we have prepared and modeled on a very interesting dataset – consisting of pairs of tiny seed photos. Our key contribution was the confirmation of the researchers’ hypothesis – dormancy is controlled by genetic mechanisms that have visual signatures at a very early stage in the development of the seeds.
Learn more about computer vision:

Appsilon is hiring for remote roles! See our Careers page for all open positions, including R Shiny Developers, Fullstack Engineers, Frontend Engineers, a Senior Infrastructure Engineer, and a Community Manager. Join Appsilon and work on groundbreaking projects with the world’s most influential Fortune 500 companies.


